Gold (XAU/USD) Remains Subdued as the DXY Continues to Advance
GOLD PRICE FORECAST:
For the Full Q3 Outlook on Gold Prices, Download the Guide Below
Recommended by Zain Vawda
Get Your Free Gold Forecast
MOST READ: Canadian Dollar Outlook: USD/CAD, GBP/CAD Rise, Is the Oil Correlation Dead?
Gold prices remain subdued with the 50-day MA capping any potential move to the upside with the help of rising US Yields and a slightly stronger US Dollar. The US Dollar also received a boost from hawkish comments from Fed Policymaker Michelle Bowman who stated that further rate hikes may be required to get inflation below target.
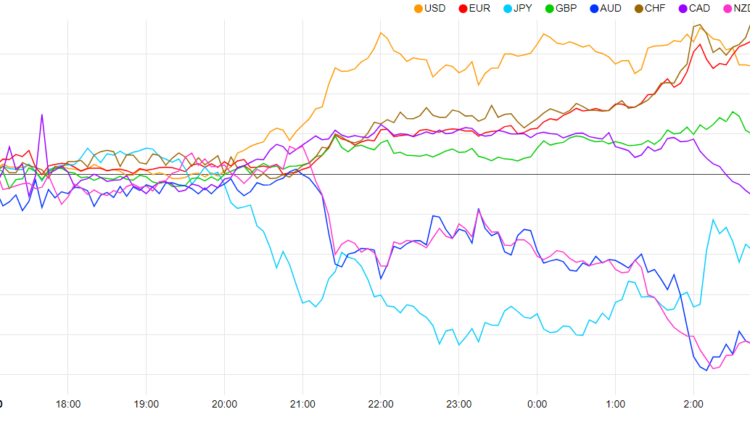
Currency Strength Chart: Strongest – USD, Weakest – AUD.
Source: FinancialJuice
DXY AND US CPI DATA
The Dollar Index (DXY) and US Yields helped keep Gold on the backfoot yesterday with Dollar strength continuing this morning. The US Dollar appears to be benefitting from a risk-off tone this morning following lackluster data from China as well as Moody’s downgrading a host of small to medium sized US Banks.
Given the cautious tone in markets it will be interesting to see if the DXY is able to hold onto gains as the US session begins. Yesterday’s rally failed to hold the high ground as the US session brought a modest pullback with the index struggling to close above the 50 and 100-day MA.
Personally, I do think we could be in for a period of consolidation heading into Thursdays US CPI print. There is not a lot on the calendar in terms of risk events today with Fed policymaker Barkin scheduled to speak later in the day. Should Barkin strike a similar tone to Michelle Bowman the Dollar may continue to rise toward a key confluence area between the 103.00-103.55 area with Gold prices likely to struggle as a result.
Dollar Index (DXY) Daily Chart – August 8, 2023

Source: TradingView, Chart Prepared by Zain Vawda
To Better Understand the Dynamics of Range Trading Get Your Free Guide Below
Recommended by Zain Vawda
The Fundamentals of Range Trading
TECHNICAL OUTLOOK AND FINAL THOUGHTS
Form a technical perspective, Gold prices do appear as though a retracement higher could be in the offing. A key support level rests around the 1927.00 to 1925 mark and a failure to break below may sweeten the narrative for bulls.
The precious metal is stuck in a tight range between the 50-day MA and the 1925.00 to 1927.00 for the last 4 days. A break and daily candle close above the 50-day MA could facilitate a run up toward the 100-day MA resting at 1967.67.
Gold (XAU/USD) Daily Chart – August 8, 2023
Source: TradingView, Chart Prepared by Zain Vawda
Alternatively, a break lower from here could lead to further declines for Gold with the 1900.00 psychological handle remaining a possibility. It is important to keep in mind that with US CPI out on Thursday price could continue to consolidate with market participants likely to minimize risk exposure and reposition ahead of the release.
Taking a quick look at the IG Client Sentiment retail trader data shows 75% of traders are net-long on Gold with the ratio of traders long to short at 3 to 1.
For a more in-depth look at sentiment, download the free guide below.
| Change in | Longs | Shorts | OI |
| Daily | 2% | 1% | 2% |
| Weekly | 13% | -12% | 5% |
Written by: Zain Vawda, Markets Writer for DailyFX.com
Contact and follow Zain on Twitter: @zvawda


Comments are closed.