Gold (XAU/USD) Giving Back Post-FOMC Record Gains But The Future Seems Bright
Gold (XAU/USD) Price, Charts, and Alaysis
- Lower US rates, recession fears, and bank woes boost gold’s allure.
- Will gold consolidate before re-testing Wednesday’s all-time high?
Recommended by Nick Cawley
Get Your Free Gold Forecast
The Federal Reserve raised rates, as expected, by 25 basis points to a range of 500-525 yesterday but the post-decision statement and press conference sent gold spiraling higher as expectations that the Fed would no longer hike rates grew. Market pricing is now for the Fed to pause its rate hiking cycle before embarking on a rate-cutting cycle at the end of Q3. Markets are already pricing in around 75 basis points of rate cuts this year, to a target range of 425-450, with additional cuts next year taking the range to 275-300 by the end of September 2024.
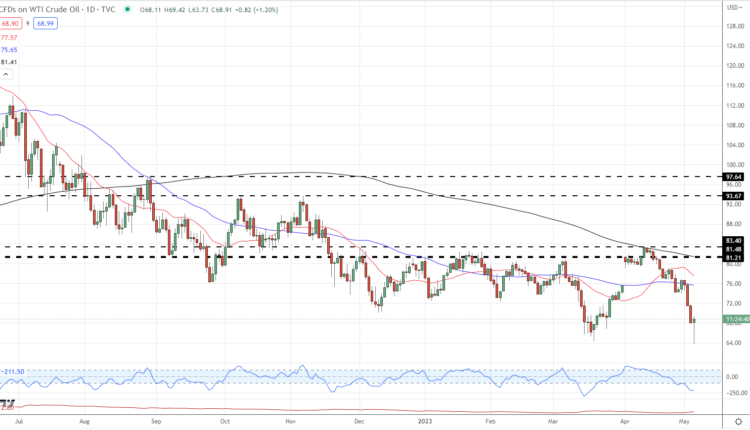
Recession fears in the US continue to swirl with growth commodities oil and copper coming under the hammer. US oil slumped to $63.73/brl. Its lowest level since early December 2021, while copper is within touching distance of making a fresh 2023 low.
US Oil Daily Price Chart – May 4, 2023
Copper Daily Price Chart – May 4, 2023

For all market-moving data releases and events, see the DailyFX Economic Calendar
In addition to the rate and recession outlook, US Regional Banks continue to come under heavy pressure after the failure of Silvergate, Silicon Valley, and Signature Bank. The latest cab off the rank is PacWest Bancorp. The California-based medium-sized holding company saw its shares slump by over 40% in after-hours trade as the company said that it was looking at strategic options including a possible break up or sale. Another US Regional Bank, Western Alliance Bancorp fell in excess of 20% in after-hours trade.
Recommended by Nick Cawley
How to Trade Gold
The combination of lower rates on the horizon, recession fears, and safe haven demand sent gold jumping yesterday to a fresh all-time high. The precious metal has been moving higher since the late-February swing low at $1,804/oz with a series of higher lows supporting the move. Yesterday’s pullback is likely to be temporary and gold looks primed to re-test its ATH and push further ahead.
Gold Price Daily Chart – May 4, 2023
Chart via TradingView
What is your view on Gold – bullish or bearish?? You can let us know via the form at the end of this piece or you can contact the author via Twitter @nickcawley1.


Comments are closed.