Gold, Silver Prices Perk Up, Palladium in Freefall, Key Levels for XAU/USD, XAG/USD
SILVER, GOLD OUTLOOK:
- Gold and silver prices rebound, but their upside is capped by the move in bond yields
- Palladium sinks to its lowest level in more than 5 years
- This article explores XAU/USD and XAG/USD’s key technical levels to monitor in the coming trading sessions
Trade Smarter – Sign up for the DailyFX Newsletter
Receive timely and compelling market commentary from the DailyFX team
Subscribe to Newsletter
Most Read: Gold, Silver Price Forecast: XAU/USD & XAG/USD May Get Boost from Macro Trends
Gold and silver prices rebounded on Thursday after several Federal Reserve officials expressed caution about what the next steps should be in terms of monetary policy, with Atlanta Fed’s Bostic indicating that the central bank's stance is probably sufficiently restrictive and Chicago Fed’s Goolsbee warning against an interest rate overshoot.
However, gains in both metals were capped by the movement in bonds. Yields have trended lower over the past week, but in today's session, they experienced a strong rally, especially those on the back end, thereby limiting the upside for XAU/USD and XAG/USD.
Meanwhile, palladium plummeted, sinking more than 4% towards the $1,000 mark and hitting its weakest point in more than 5 years as its fundamentals continued to deteriorate.
Eager to gain insights into gold's future trajectory and the upcoming market drivers for volatility? Discover the answers in our complimentary Q4 trading guide. Download it for free now!
Recommended by Diego Colman
Get Your Free Gold Forecast
Demand for palladium, used in catalytic converters to reduce emissions from gasoline-powered vehicles, has been negatively affected in recent years by the rapid societal shift to electric cars. The substitution of palladium for cheaper platinum has also hurt the metal, which is expected to be in structural surplus in 2024. Against this backdrop, prices could fall below $1,000 and stay beneath that threshold before long.
Turning back to gold and silver, their near-term prospects will likely depend more on the dynamics of monetary policy, the broader U.S. dollar, and geopolitics.
On the geopolitical front, Israel's invasion of Gaza following the Hamas terrorist attacks, while tragic, has not degenerated into a broader Middle East conflict involving other countries, such as Iran or Lebanon. This could reduce the demand for safe-haven assets, temporarily limiting the appetite for precious metals.
Be that as it may, there are reasons to be optimistic about gold and silver. One catalyst that could put upward pressure on their prices is the trend in yields. Last month, the yield on 10-year bond topped 5.0%, but has since undergone a sharp correction, trading today at around 4.65%. If the downturn in rates accelerates on the back of renewed recession fears, XAU/USD and XAG/USD may have scope to rally further.
Acquire the knowledge needed for maintaining trading consistency. Grab your “How to Trade Gold” guide for invaluable insights and tips!
Recommended by Diego Colman
How to Trade Gold
GOLD PRICE TECHNICAL ANALYSIS
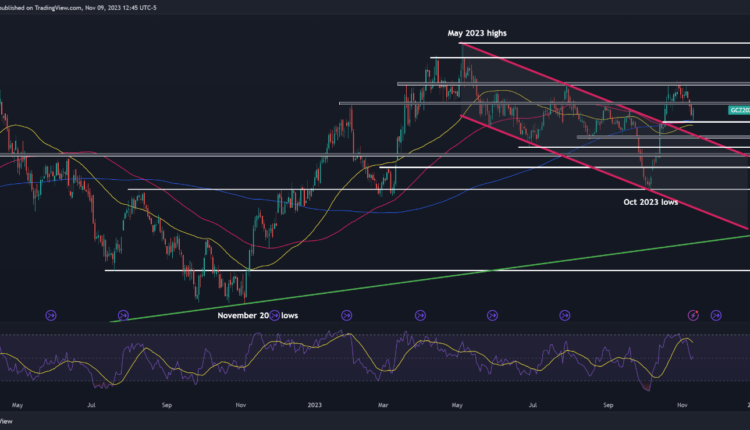
Earlier this week, gold experienced a minor setback when the bulls failed to breach a key ceiling in the $2,010/$2,015 range. However, prices have started to perk up after encountering support around the 200-day simple moving average, paving the way for Thursday’s modest advance. If gains accelerate in the coming days, resistance is located at $1,980. On further strength, the focus shifts to $2,010/$2,015 again.
On the other hand, if the bears stage a comeback and propel prices downward, the first area to keep an eye on is $1,945, which aligns with the 200-day SMA. Although gold might find support in this region during a retracement, a breakdown could pave the way for a slump towards $1,920. Below this threshold, the spotlight turns to the psychological $1,900 level.
GOLD PRICE CHART (FRONT-MONTH FUTURES)
Source: TradingView
Wondering how retail positioning can shape silver prices? Our sentiment guide provides the answers you seek—don't miss out, download it now!
| Change in | Longs | Shorts | OI |
| Daily | -2% | 9% | -1% |
| Weekly | -3% | 24% | 0% |
SILVER PRICE TECHNICAL ANALYSIS
After selling off in recent days, silver appears to have stabilized around trendline support at $22.65. If prices manage to rebound sustainably from current levels, technical resistance is located at $23.35, just around the 200-day simple moving average. Upside clearance of this ceiling could rekindle bullish momentum, paving the way for a retest of the psychological $24.00 level.
Conversely, if sellers regain control of the market and push prices below $22.65, we could witness a pullback towards $22.20. In case of continued weakness, the attention will shift to the October lows near the $21.00 mark.
SILVER PRICE CHART (FRONT-MONTH FUTURES)

Source: TradingView


Comments are closed.