Gold Prices Turn to US Initial Jobless Claims to Gauge SVB Economic Shock
Gold, XAU/USD, Federal Reserve, Jobless Claims – Briefing:
- Gold prices gained on the Fed as USD and Treasury yields fell
- All now focus on US initial jobless claims to gauge SVB impact
- XAU/USD turned back towards key resistance, where to next?
Recommended by Daniel Dubrovsky
How to Trade Gold
Gold prices gained about 1.6% on Wednesday in the aftermath of the Federal Reserve rate decision and Chair Jerome Powell’s press conference. The takeaway from the Fed was that Mr Powell stressed that at this time, policymakers did not see the case for rate cuts this year. The latter is something that markets have been aggressively pricing in since SVB’s collapse.
Still, markets focused on the less hawkish shift in the Fed policy statement. Policymakers downgraded the messaging about rate hikes being as “ongoing increases” to “anticipating” some extra firming as appropriate. The 2-year Treasury yield and US Dollar turned lower on the Fed. Gold typically functions as the anti-fiat instrument. As such, XAU/USD welcomed the decline in the greenback and bond yields.
Understand that markets remain firmly on the anticipated rate cut path for this year while Fed projections do not. If the latter ends up being the story, gold would be at risk of giving up its progress since earlier this month. With that in mind, what is gold facing over the remaining 24 hours?
All eyes turn to US initial jobless claims due at 12:30 GMT. Economists anticipate unemployment filings to clock in at +197k last week compared to +192k prior. Jobless claims are one of the few timely pieces of data we have on the labor market. It will offer a slight glimpse into how the economy is faring in the first full week after Silicon Valley Bank collapsed. An unexpectedly strong surge could confirm market expectations of rate cuts. That may benefit gold.
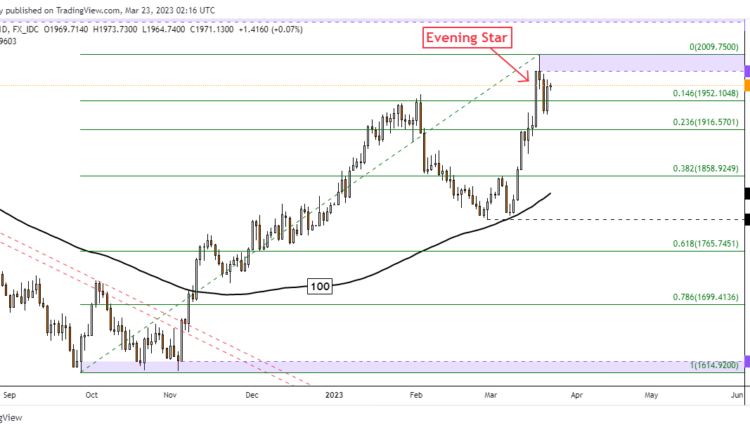
XAU/USD Daily Chart
On the daily chart, gold can be seen turning back higher to the critical 1998 – 2009 resistance zone. This is undermining the emergence of a bearish Evening Star candlestick pattern. A confirmatory close above this resistance range would open the door to an increasingly bullish outlook. Otherwise, extending lower places the focus on the 23.6% Fibonacci retracement level at 1916.
Trade Smarter – Sign up for the DailyFX Newsletter
Receive timely and compelling market commentary from the DailyFX team
Subscribe to Newsletter
Chart Created Using TradingView
— Written by Daniel Dubrovsky, Senior Strategist for DailyFX.com
To contact Daniel, follow him on Twitter:@ddubrovskyFX


Comments are closed.