Gold Price Slips Lower as Markets Turn Risk-on, FOMC Will Guide the Next Move
Gold Price (XAU/USD), Chart, and Analysis
- Gold slips as safe-haven bid recedes for now.
- Will it be ‘one and done’ for the Fed tomorrow?
Recommended by Nick Cawley
How to Trade Gold
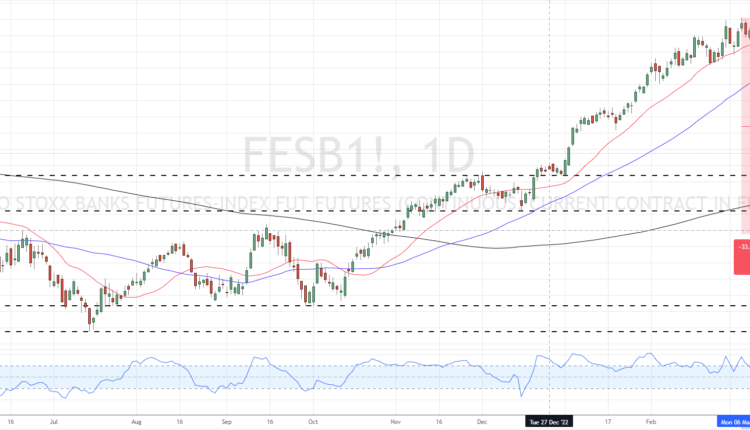
Risk markets are pushing higher in early European turnover as fears of an impending banking crisis are put on hold, while safe-haven markets give back some of their recent hefty gains. The DAX 40 and the FTSE 100 are both showing gains of 1.4%, while the safe-haven Japanese Yen has slipped against the US dollar by 0.75%. Gold is also moving lower and currently trades around $1,966/oz. after having touched a one-year high of just under $2,010/oz. on Monday. The banking sector is enjoying a move higher today despite all the fears surrounding the space. The E Stoxx banking futures currently change hands at 99.30 after having hit a nadir of 86.80 during Monday’s sell-off. The index traded at 120 earlier this month before the SVB and Credit Suisse sell-off hit sentiment.
E Stoxx Banking Futures
Wednesday’s FOMC meeting may well see the last Fed rate hike of this cycle with the market currently predicting a 25bps increase tomorrow, a pause, and then three 25bps cuts during the rest of 2023. While inflation remains uncomfortably high in the US, further rate hikes are now off the table due to the recent banking crisis. The Fed’s aggressive hiking policy is being felt in the financial sector and there are fears that further rate hikes may curtail bank lending, hitting economic growth hard.
US Rate Hike Expectations

The outlook for gold remains positive despite the recent move lower. A more dovish Federal Reserve will ally further rate hike fears while worries that the current global banking crisis may flare up again, giving the precious metal an ongoing safety bid. Initial support is seen around $1,950/oz. before $1,920/oz. comes into view. Monday’s $2,010/oz. high will act as resistance in the short term.
Gold Price Daily Chart – March 21, 2023
All Charts via TradingView
| Change in | Longs | Shorts | OI |
| Daily | 4% | 10% | 7% |
| Weekly | -13% | 30% | 2% |
Retail Traders Trim Net-Longs
Retail trader data show 54.03% of traders are net-long with the ratio of traders long to short at 1.18 to 1.The number of traders net-long is 4.87% higher than yesterday and 11.00% lower from last week, while the number of traders net-short is 2.80% higher than yesterday and 26.63% higher from last week.
We typically take a contrarian view to crowd sentiment, and the fact traders are net-long suggests Gold prices may continue to fall. Positioning is more net-long than yesterday but less net-long from last week. The combination of current sentiment and recent changes gives us a further mixed Gold trading bias.
What is your view on Gold – bullish or bearish?? You can let us know via the form at the end of this piece or you can contact the author via Twitter @nickcawley1.


Comments are closed.