Gold Price Pauses as US Dollar Stalls on Sinking Yields. Where to for XAU/USD?
Gold, XAU/USD, US Dollar, Treasury Yields, Fed, GZW Index, Breakout – Talking Points
- The gold price is padding for time as it continues to trade the range
- Treasury yields have slid lower this week, but inflation expectations are anchored
- If inflation data surprises later this week, will it move the dial on real yields and gold?
Recommended by Daniel McCarthy
How to Trade Gold
Gold continues to wade near all-time highs with a languishing US Dollar undermined by dipping Treasury yields.
The yellow metal can be sensitive to movements in the interest rates of other highly traded assets as it does not produce a return other than capital gains or losses, although there is a cost of carry for the commodity.
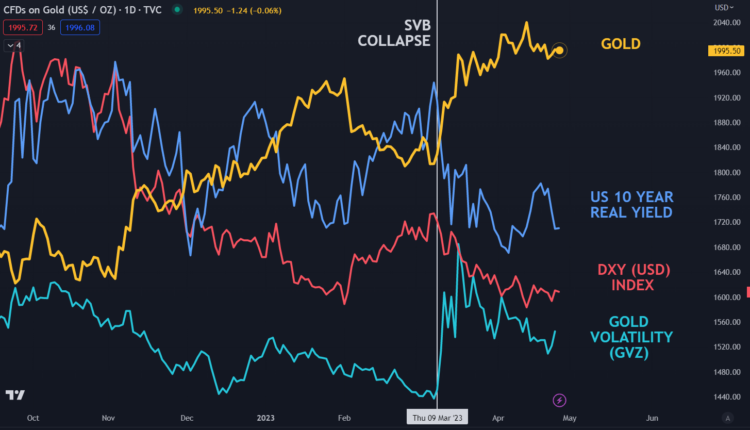
The somewhat puzzling part of the precious metal price action this week has been the demise of real yields in the US not assisting the push toward a new peak.
The real yield is the nominal yield on the Treasury bond less market-priced inflation for the same tenor. This inflation rate is derived from the TIPS (Treasury Inflation-Protected Security) yield.
A week ago, the US 10-year real yield eclipsed 1.35% but has since crumbled toward 1.13% this week while gold has continued to tread water near US$ 2,000 an ounce.
At the same time, volatility appears sedate, with the GVZ index remaining subdued below 18. The GWZ index is a similar measure of volatility for gold in the way that the VIX index measures volatility for the S&P 500 equity index.
Looking ahead, US GDP and core PCE data will be the focus on Thursday, but the Federal Open Market Committee (FOMC) meeting this time next week might be the catalyst for a large move in gold.
Trade Smarter – Sign up for the DailyFX Newsletter
Receive timely and compelling market commentary from the DailyFX team
Subscribe to Newsletter
GOLD AGAINST US DOLLAR (DXY), US 10-YEAR REAL YIELDS AND VOLATILITY (GVZ)
Chart created in TradingView
GOLD TECHNICAL ANALYSIS
Gold has been caught in a 1934 – 2049 range for around six weeks and it remains within an ascending trend channel.
The lack of short-term direction is characterised by the price clustering near the 10- and 21-day Simple Moving Averages (SMA).
A breakout of the range might see momentum build for that direction but notable support and resistance levels lie on both sides.
To the topside, there is a Double Top created by the all-time high of 2075 in April 2020 and the failed attempt to break above it in March 2022 when a peak of 2070 was made.
On the downside, the 1885 – 1895 area appears to be a key support zone. Within it lies the 100-day SMA, a previos low, a breakpoint and an ascending tend line.

Chart created in TradingView
— Written by Daniel McCarthy, Strategist for DailyFX.com
Please contact Daniel via @DanMcCathyFX on Twitter


Comments are closed.