GBP/USD turns negative, with bears eyeing 1.2000 below the 100-DMA
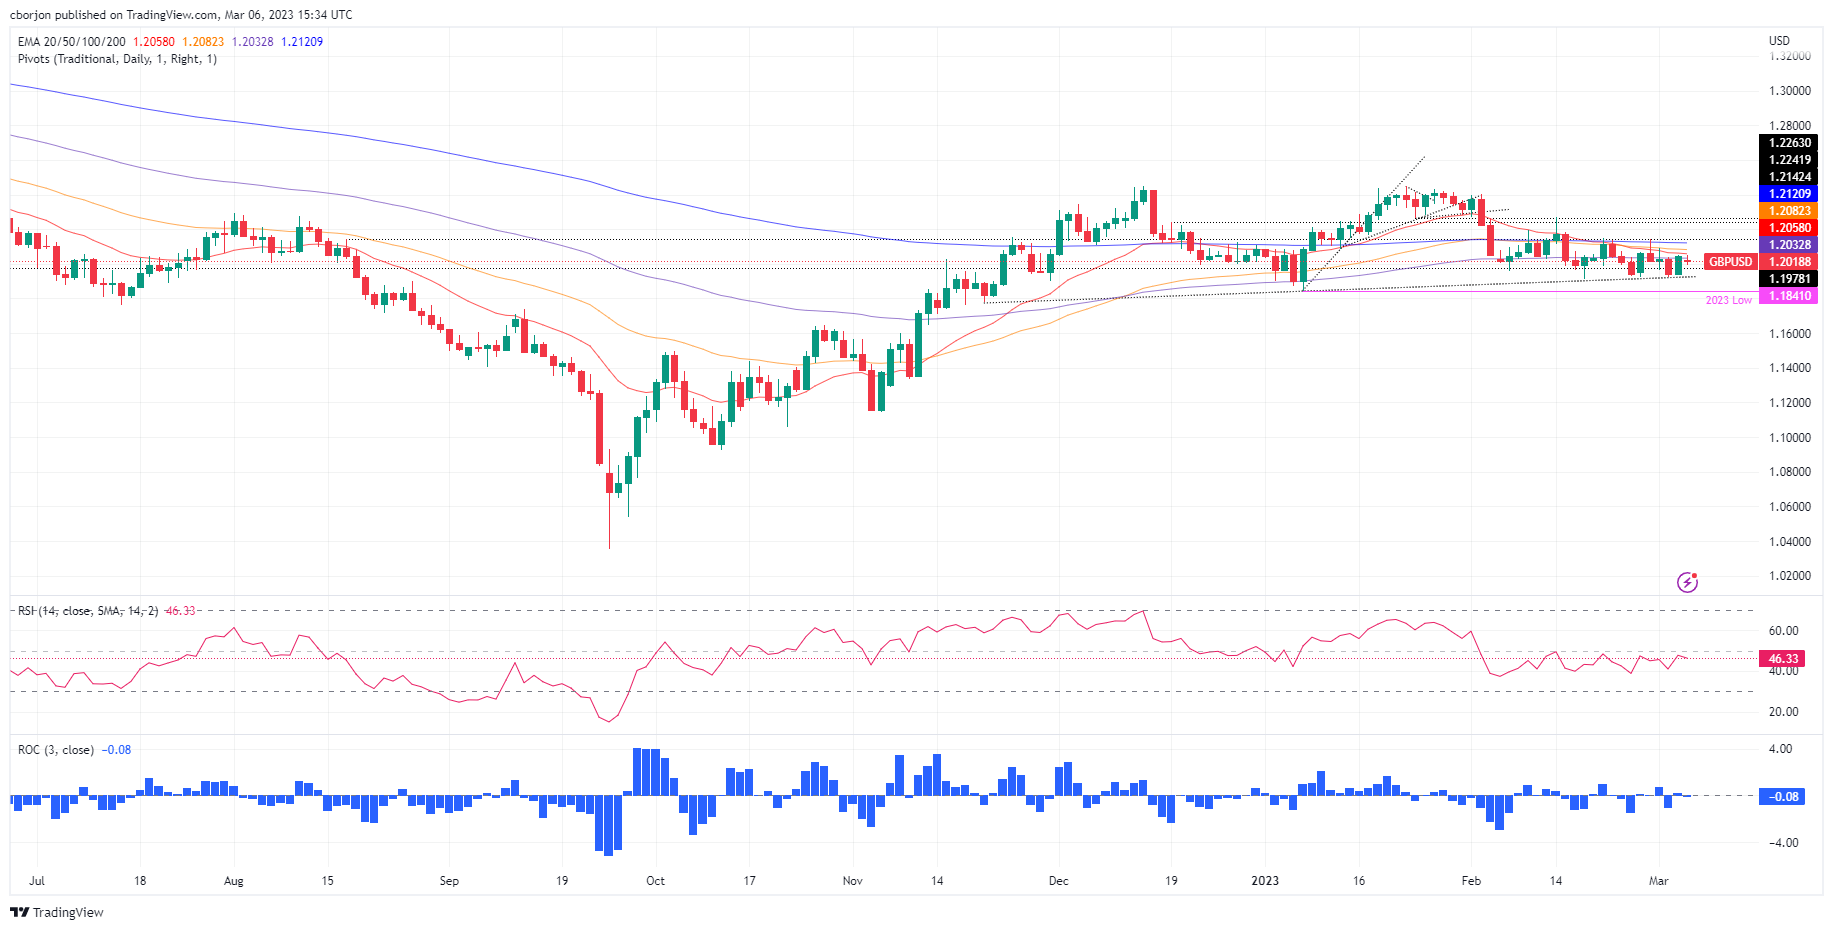
- GBP/USD tests the 100-day Exponential Moving Average at 1.2033.
- Traders are focused on growth figures from the UK, Fed Chair Powell’s speech at Congress, and US NFP figures.
- GBP/USD Price Analysis: Consolidated, waiting for a fresh catalyst to get direction.
GBP/USD trims some of last Friday’s gains despite an upbeat sentiment led by Wall Street, opening in the green. A light calendar in the United Kingdom (UK) would keep traders focused on the busiest docket in the United States (US). At the time of writing, the GBP/USD is trading at 1.2019.
The GBP/USD at the mercy of US economic data
As abovementioned, risk sentiment is a mixed bag. The UK economic calendar will reveal the Gross Domestic Product (GDP) on Friday, ahead of the Bank of England’s (BoE) March 23 meeting. The US economic docket will feature Factory Orders for January, foreseen to fall to -1.8%, below the prior’s month reading of 1.8%.
The greenback (USD) is printing losses, capping the GBP/USD’s fall below the 1.2000 figure. The US Dollar Index (DXY), a gauge of the buck’s value vs. a basket of six currencies, extended its losses, by 0.14%, at 104.380. Meanwhile, US Treasury bond yields, which underpinned the USD last week’s price action, are down, with the 10-year benchmark note rate below 4%, at 3.950%.
The week could be volatile due to US Federal Reserve (Fed) Chairman Jerome Powell’s appearance at the US Congress on March 7 and 8. Analysts expect Powell to maintain a hawkish stance, echoing some of his colleague’s tone. He’s expected to reiterate that interest rates must go higher for longer if the US economy continues to print solid data.
Following astonishing January data, the US Nonfarm Payrolls figures are awaited on Friday. Market participants estimate the US economy added 200K jobs to the economy. Any figures below expectations would weigh on the USD, meaning the GBP/USD could appreciate. On the flip side, stronger data would warrant further tightening by the Fed.
GBP/USD Technical levels
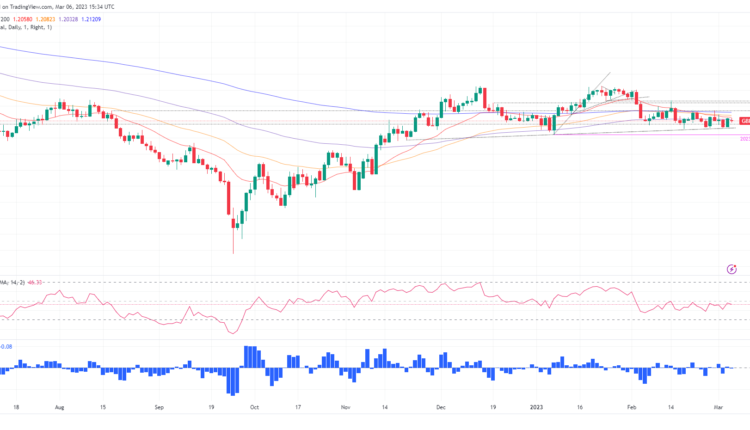
The GBP/USD daily chart suggests that the pair is bottoming around 1.2000. The Relative Strength Index (RSI) is in bearish territory, with a downward slope, meaning that sellers are in control. The Rate of Change (RoC) suggests the sellers are losing momentum. Therefore mixed signals within oscillators suggest the GBP/USD pair is sideways. For a bullish continuation, the GBP/USD must clear the 200-day EMA at 1.2120. On the bearish front, the GBP/USD must break below the 100-day EMA at 1.2033 and beneath 1.2000 to pave the way for further losses.


Comments are closed.