
GBP/USD, BRITISH POUND – Technical Outlook:
- GBP/USD continues to be in a range from a short-term perspective.
- However, the medium-term prospects remain promising.
- What are the signposts to watch?
Recommended by Manish Jaradi
How to Trade GBP/USD
GBP/USD SHORT-TERM TECHNICAL FORECAST – NEUTRAL
GBP/USD’s short-term range prospects haven’t changed as we enter the final countdown to key interest rate decisions, beginning with the US Federal Reserve today, and the Bank of England (BOE) and the European Central Bank (ECB) tomorrow.
The Fed is widely expected to hike rates by 25 basis points to 4.5%-4.75% on Wednesday. The key focus will be the accompanying statement, especially any guidance on the path of interest rates. The ECB and the BOE are widely expected to raise interest rates by 50 bps. A ‘hawkish hike’ by the BOE could support GBP from a medium-term perspective.
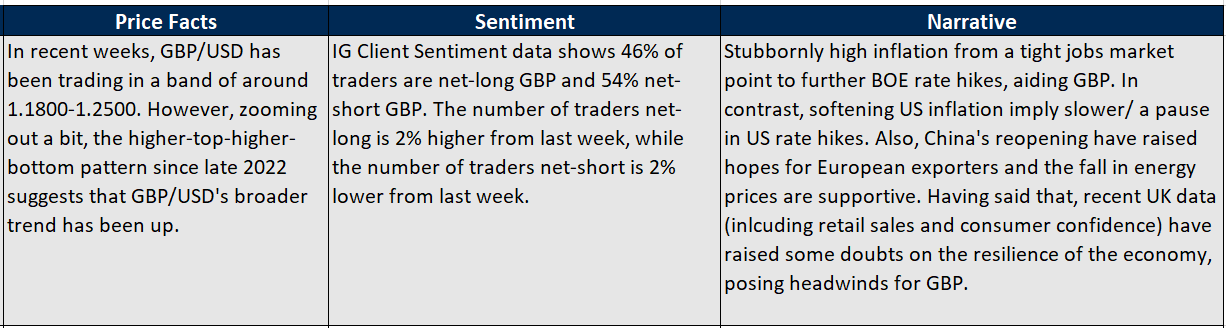
Price Facts, Sentiment, Narrative

On technical charts, there is a case for medium-term strength in GBP/USD, firsthighlighted in Octoberand subsequentlyin mid-November. The price action in recent months bolsters the chances of a significant upside in the pair. Asthe January 20 update highlighted, a decisive break above key converged resistance: a slightly upward-sloping trendline from August (now at about 1.2490), roughly coinciding with the December high of 1.2445 would trigger a major reverse head & shoulders pattern (the left shoulder at the July low, the head at the September low, and the right shoulder at the January low), pointing to a potential rise toward the 2021 high of 1.4250.
GBP/USD Daily Chart
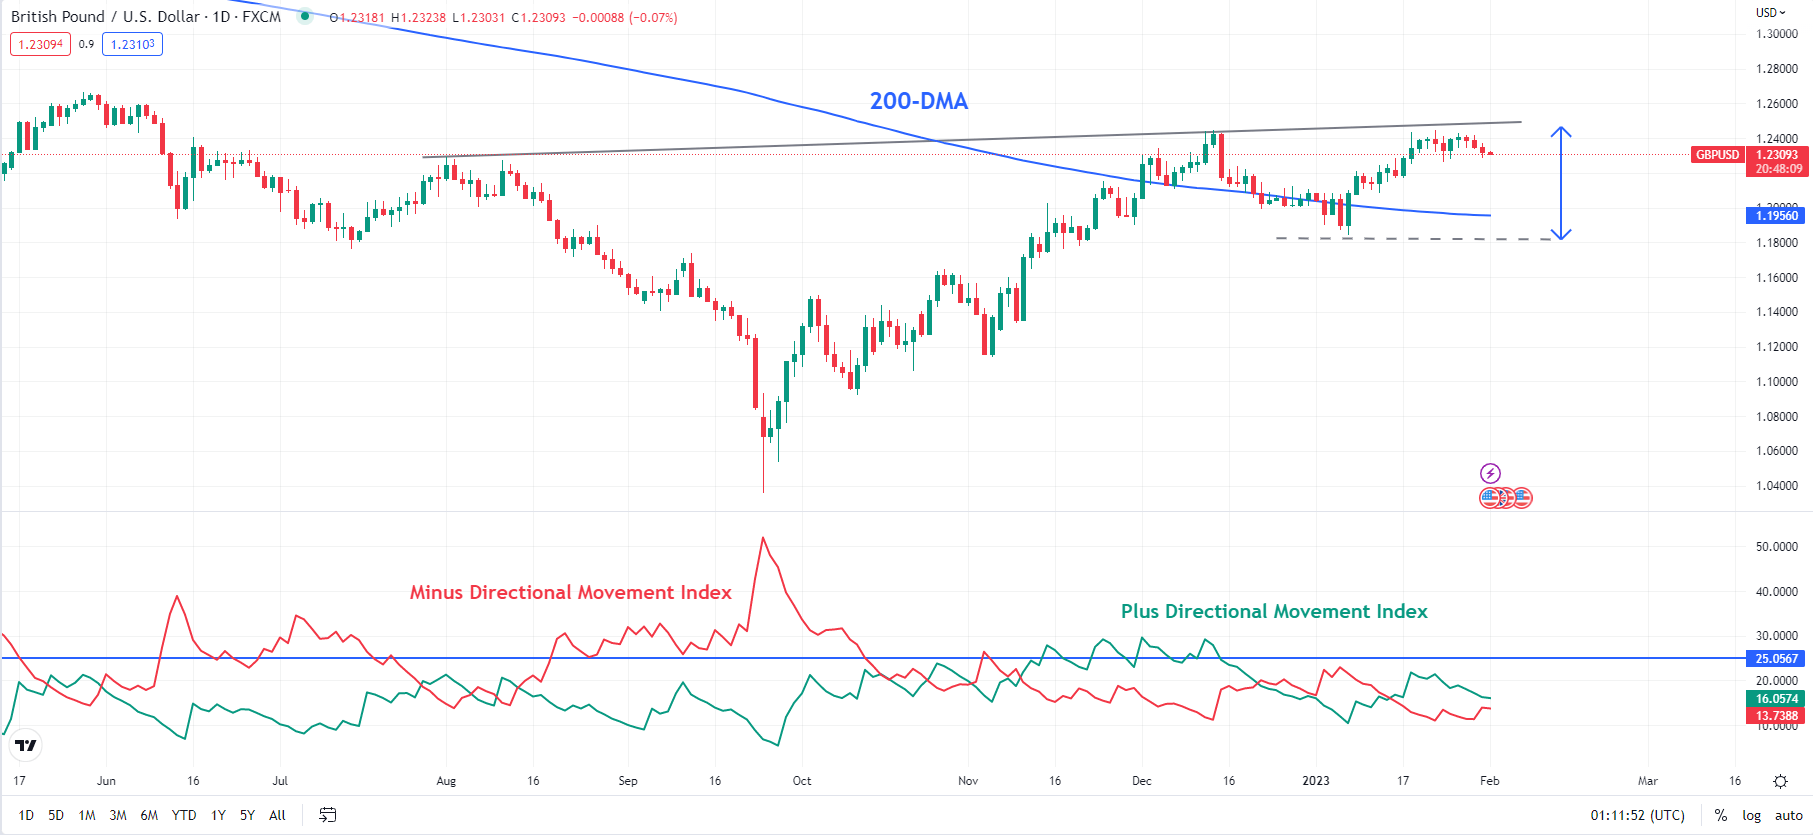
Chart Created Using TradingView
In the immediate term, prospects for GBP/USD haven’t changed much from the previous updates (seeend of November update hereandmid-January here). The pair continues to be in the 1.1840-1.2490 band. As the daily chart shows, Plus Directional Movement Index (DMI) and Minus DMI continue to be below 25, pointing to range conditions in the short term.
GBP/USD 240-Minutes Chart
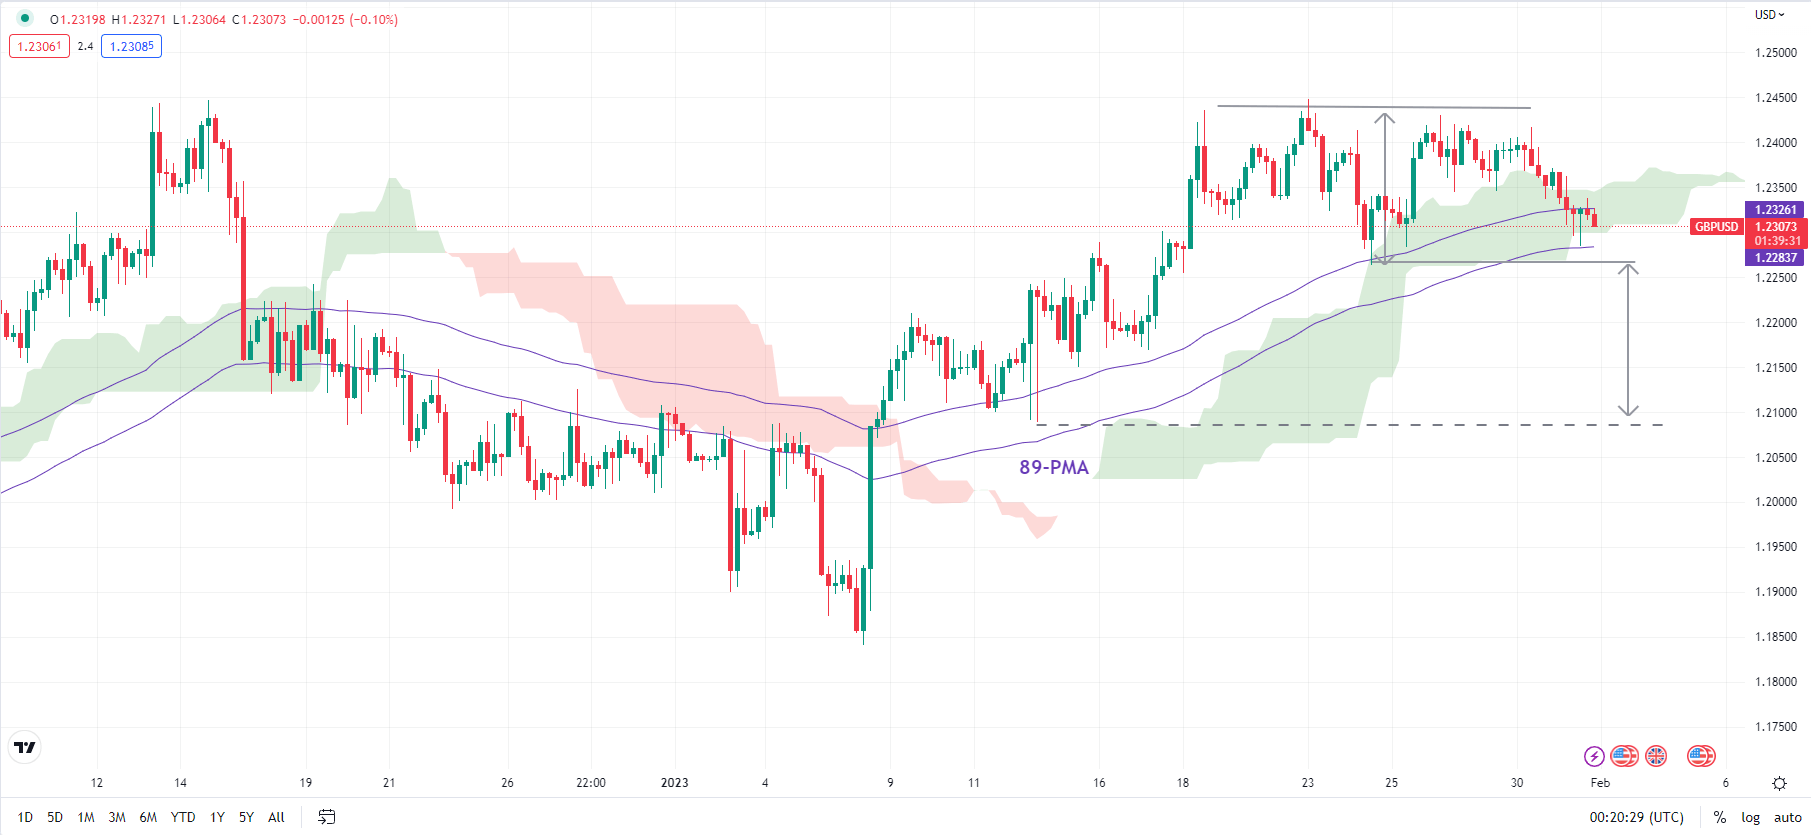
Chart Created Using TradingView
Zooming in on intraday charts, last week’s low of 1.2260 is initial support. Any break below could trigger a minor double top (last week’s highs), raising the odds of a drop toward 1.2100. However, there is quite strong support at the lower end of the range at 1.1840.
— Written by Manish Jaradi, Strategist for DailyFX.com
Comments are closed.