Further upside hinges on 0.6270 breakout
- NZD/USD seesaws in a choppy range after confirming a bullish chart formation and refreshing two-week high.
- Convergence of 21-day EMA, 200-day EMA challenges Kiwi pair buyers.
- Looming bull cross on MACD defends upside bias.
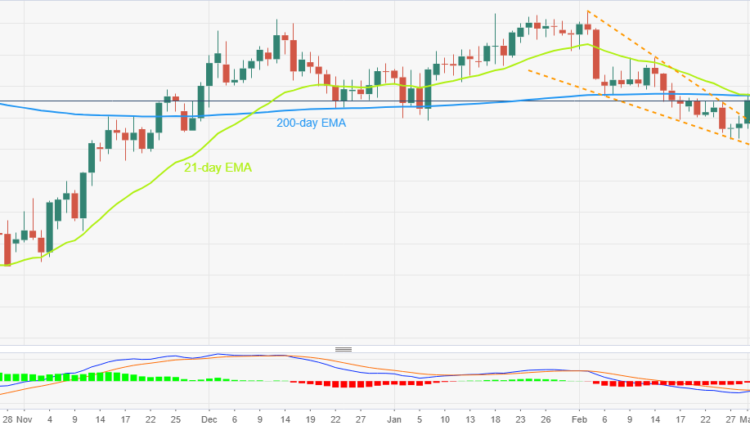
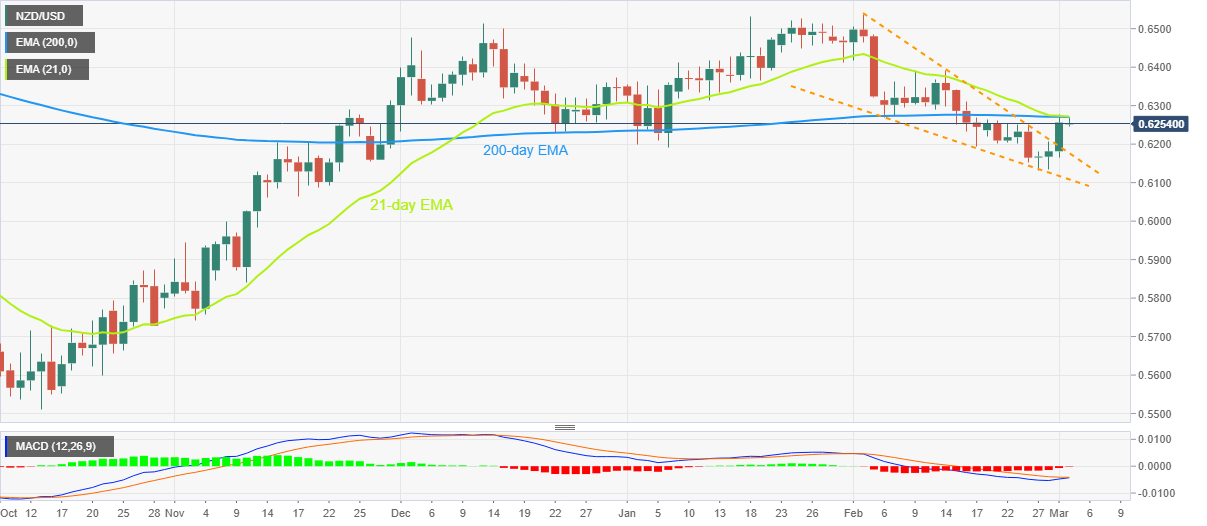
NZD/USD bulls struggle to justify the falling wedge breakout as the key moving averages challenge upside near the mid-0.6200s during early Thursday. However, the impending bull cross on the MACD indicator keeps the Kiwi pair buyers hopeful, especially after the confirmation of the bullish chart pattern the previous day.
The upside break of a one-month-old falling wedge bullish formation failed to cross the convergence of the 200-day Exponential Moving Average (EMA) and the 21-day EMA, around 0.6270 by the press time.
Should the quote crosses the immediate hurdle, as expected due to the MACD conditions and falling wedge confirmation, the NZD/USD can quickly poke the mid-February swing high surrounding 0.6390.
In a case where the Kiwi buyers keep the reins past 0.6390, as well as cross the 0.6400 threshold, the highs marked in the last December and the previous month, respectively near 0.6515 and 0.6540, could act as buffers during the theoretical run-up targeting 0.6600.
Meanwhile, pullback moves remain less important until the quote stays beyond the aforementioned wedge’s top line, close to 0.6175 at the latest.
It’s worth noting that January’s low of 0.6190 acts as the immediate support for the NZD/USD bears to watch during the fresh fall.
That said, lows marked during November 14 and 17 around 0.6060 appear the key for the pair sellers to track as a break of which won’t hesitate to challenge the 0.6000 psychological magnet.
NZD/USD: Daily chart
Trend: Further upside expected


Comments are closed.