Forex Watchlist: U.S. Dollar’s Downtrend Ahead of the Core PCE Report
The U.S. dollar is having a mid-week crisis!
Okay, “crisis” might be an exaggeration.
But the U.S. dollar index (DXY) did see a mid-week reversal!
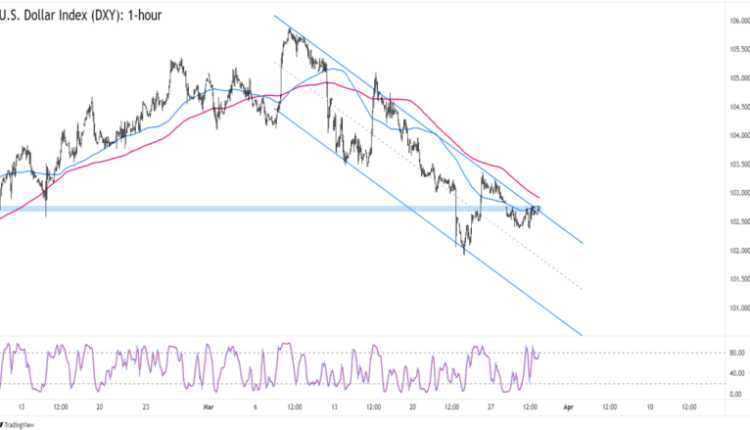
U.S. Dollar Index (DXY): 1-hour

U.S. Dollar Index (DXY) 1-Hour Forex Chart by TradingView
Just as the index was extending a downtrend that started on March 8, enough bulls stepped in and defended the 102.40 level.
DXY is now trading closer to 102.80, which is right back at a descending channel resistance on the 1-hour time frame.
What’s more, the level also lines up with a key support zone from mid-February.
Last but not the least, DXY’s current levels are near the 100 and 200 SMA resistance zones.
Will we see a breakout in the next trading sessions?
It depends on whether the markets will go back to pricing interest rate hikes from the Fed.
Recall that the U.S. dollar started dropping not only from local banking sector concerns but from the bias that the Fed miiiight consider rate cuts as early as this year.
With Uncle Sam’s core PCE index – the Fed’s preferred inflation gauge – coming up tomorrow at 12:30 pm GMT, focus will turn back to the Fed’s tightening plans.
If inflation proves to be stickier than markets are expecting in February, then the Fed might not have much choice but to raise its rates again. At the very least, it would ease some of the markets’ rate cut expectations.
DXY could break above its channel and the SMAs and retest previous areas of interest like 103.00 or 103.40.
But if consumer prices decelerates further, then rate cut expectations would gain momentum and probably drag the dollar lower.
DXY could extend its drop and revisit last week’s lows near 102.00.
This content is strictly for informational purposes only and does not constitute as investment advice. Trading any financial market involves risk. Please read our Risk Disclosure to make sure you understand the risks involved.


Comments are closed.