EUR/USD Stuck Between Confluence Support and Fibonacci Resistance. Now What?
EURO FORECAST:
- The euro has risen aggressively in recent weeks, but its bullish momentum has started to fade
- The pair appears to have entered a period of consolidation amid lack of fresh market catalysts
- This article looks at key EUR/USD’s technical levels to watch in the coming days
Recommended by Diego Colman
Get Your Free EUR Forecast
Most Read: EUR/USD Breakout Gains Momentum but Fibonacci Resistance on Radar
EUR/USD rallied strongly during the first half of the month, driven by broad-based weakness in the U.S. dollar following softer-than-expected U.S. inflation data. Against this backdrop, the pair soared to multi-month highs, showing a strong bullish impetus during its journey higher.
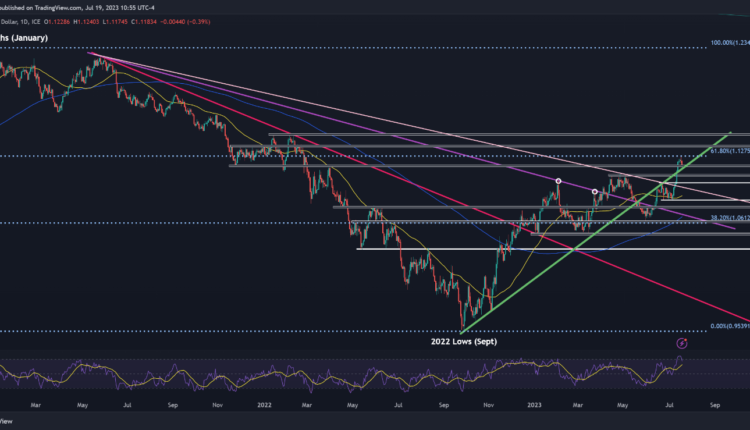
However, the upward momentum has been waning over the past few trading sessions in the absence of new catalysts. In this context, EUR/USD seems to have entered a consolidation phase, with the exchange rate stuck between Fibonacci resistance at 1.1275 and confluence support at 1.1170.
For short-term guidance on the likely market trajectory, traders should closely monitor price action and the direction in which it resolves once the consolidation is complete. That said, there are two possible scenarios worth highlighting for this week and ahead of next Wednesday's Fed decision.
Recommended by Diego Colman
How to Trade EUR/USD
Scenario 1: Support is violated
If confluence support at 1.1170, where a medium-term trendline aligns with several swing highs and swing lows, is ultimately breached, sellers could regain the upper hand, setting the stage for a move toward 1.1080. On further weakness, the focus shifts lower to the psychological 1.1000 level.
Scenario 2: Resistance is taken out
Earlier in the week, EUR/USD was rejected from 1.1275, a key barrier defined by the 61.8% Fibonacci retracement of the 2021/2022 decline. On a retest, the pair could face the same fate, but in the event of a topside breakout, bulls could launch an assault on 1.1380, followed by 1.1500.
| Change in | Longs | Shorts | OI |
| Daily | -2% | -4% | -4% |
| Weekly | 1% | 13% | 10% |
EUR/USD TECHNICAL CHART
EUR/USD Technical Chart Creating Using TradingView


Comments are closed.