

US Dollar (DXY) Analysis
- Better than feared economic data adds to recent dollar drivers
- US treasury yields climb higher as interest rate expectations anticipate outside chance of another 25-bps hike form the Fed
- DXY breaks 103.0 with ease, eying March high around 105.65
- The analysis in this article makes use of chart patterns and key support and resistance levels. For more information visit our comprehensive education library
Recommended by Richard Snow
Get Your Free USD Forecast
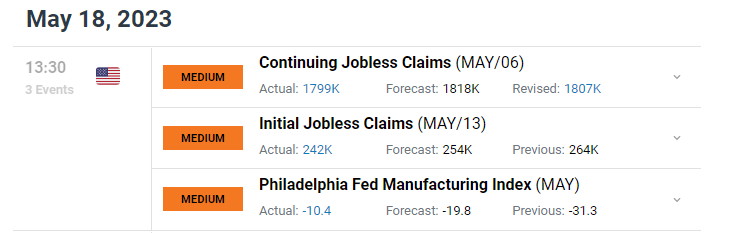
Initial Jobless Claims Print Better Ease After Last Week’s Larger Print
Last week’s initial jobless claims raised many eyebrows after coming in at 264k, suggesting that tighter financial conditions is beginning to take its toll on the labor market, lowering the chances of another rate hike form the Fed. However, this week the print came in at 242k, below consensus of 254k. At the same time the less followed Philadelphia manufacturing index came in at -10.4 vs forecast of -19.8. The health of the manufacturing sector appeared to take a sharp turn lower after the NY Empire State Manufacturing Index unexpectedly sank to 031.8 in May from 10.8 in April.
Customize and filter live economic data via our DailyFX economic calendar
US Yields Aid the Dollar’s Bullish Momentum
Both the 10-year and more interest rate sensitive 2year treasury yields continued to rise early in the US session, helping lift the dollar (DXY).
US 2-Year Treasury Yield Daily Chart
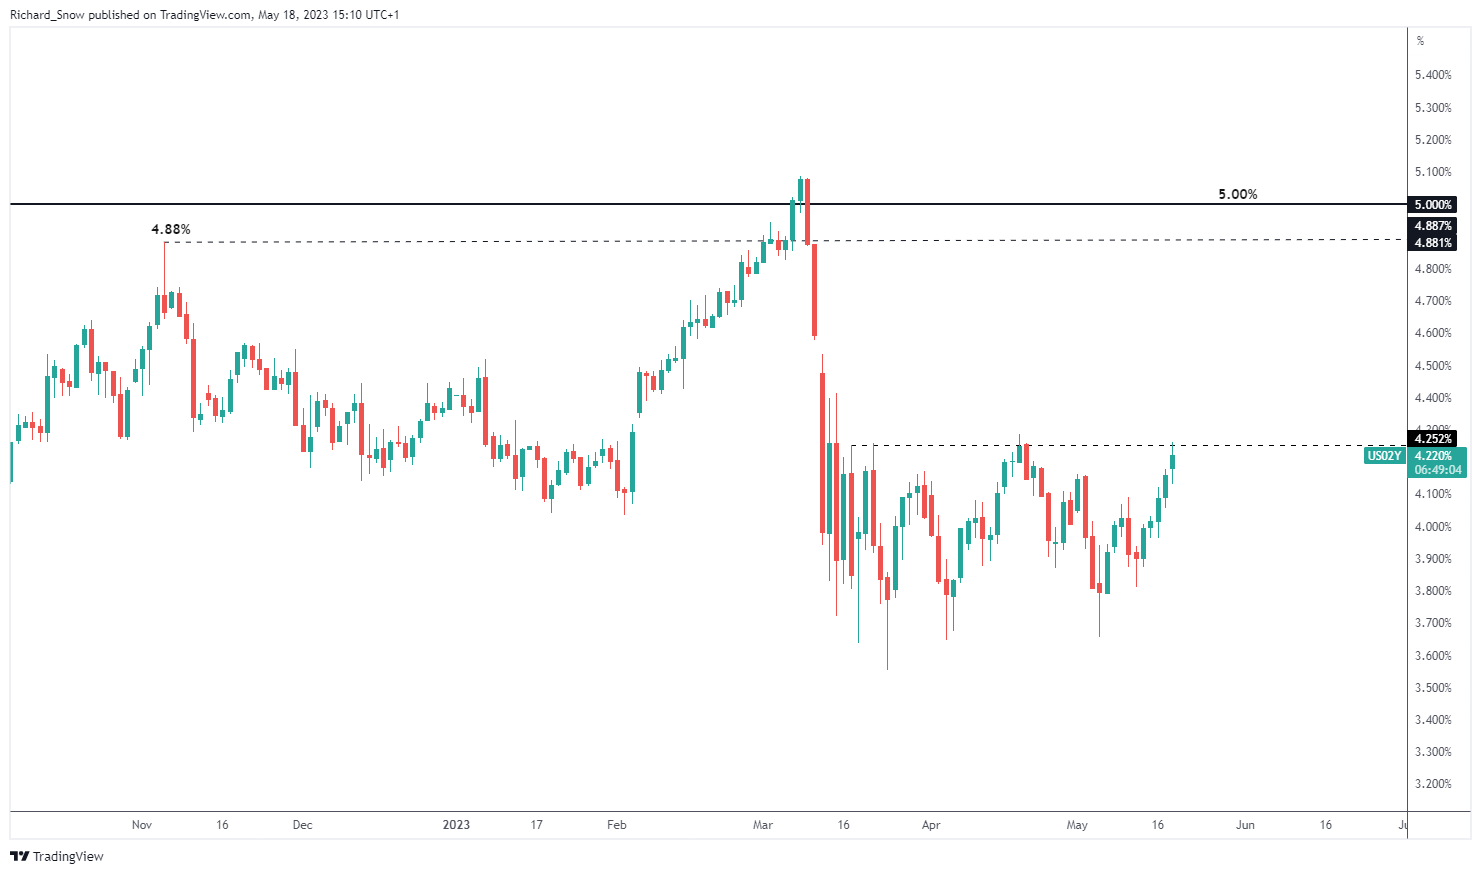
Source: TradingView, prepared by Richard Snow
As fundamental data ebbs and flows, we’re likely to see mixed reaction in the market however, the recent dollar trend has been one-sided. Initially the dollar appeared to be driven by the uncertainty around a potential US default resulting from the failure to agree to raise the debt ceiling. Now, it would appear that the dollar is pricing in a greater probability of another 25-basis point hike as the FedWatch tool reveals below. Markets now anticipate a 36% chance we could get another hike in June, up from just a 10% chance one week ago.
CME FedWatch Tool
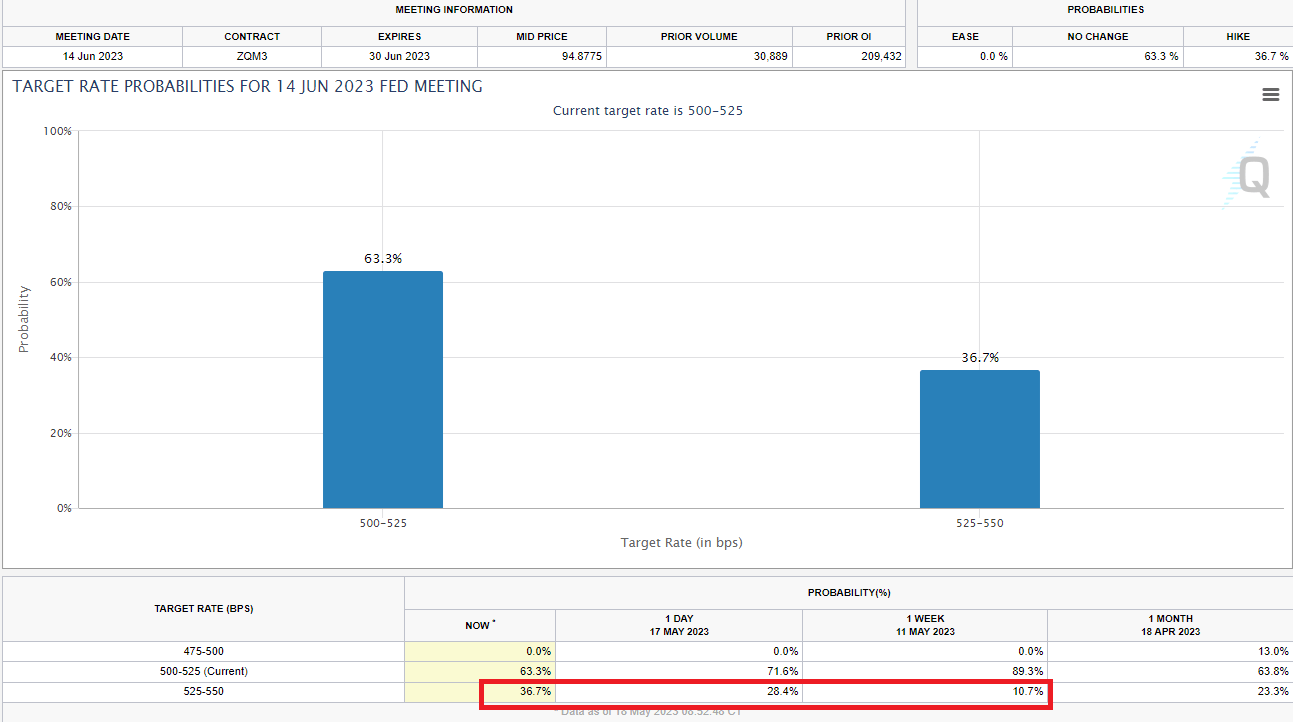
Source: CME FedWatch Tool, prepared by Richard Snow
DXY Technical Analysis
The US dollar basket has risen since the latter stages of last week and hasn’t looked back. After breaking out of the horizontal channel, the index made and attempt at trading above 103.00 – a level that has come into play numerous times in 2023. Today’s continued bullish momentum has sent DXY well above 103, showing few signs of pulling back.
In the event DXY closes above 103, that would bring into focus the January and March highs which appear some distance away at 105.65 and 105.88, respectively. If DXY closes above 103 then naturally it will become relevant as the nearest level of support followed by the upper-bound of the horizontal channel, around 102.25 and then 101.00 flat. The sheer momentum of the current move could soon see the market overheat – the RSI can be used as a gauge for this.
US Dollar Basket (DXY) Daily Chart
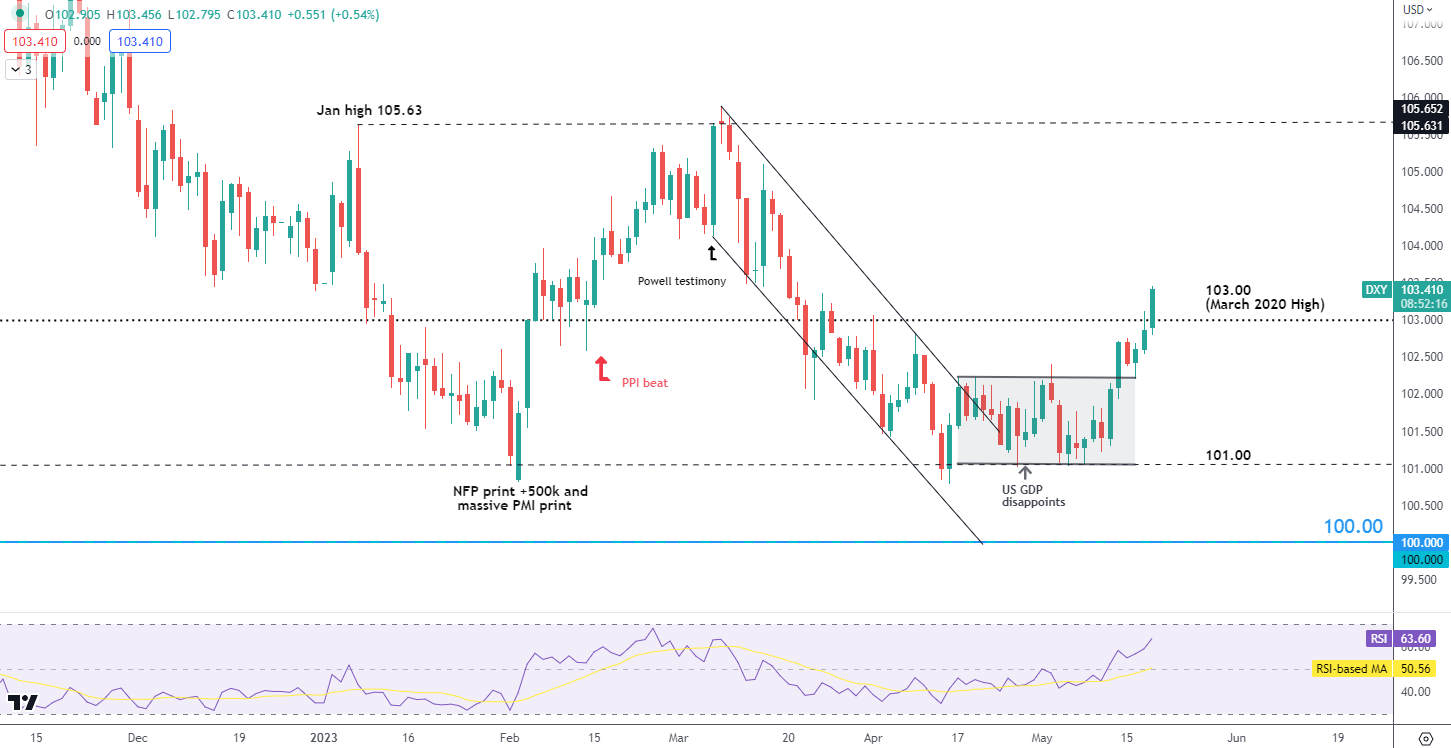
Source: TradingView, prepared by Richard Snow
— Written by Richard Snow for DailyFX.com
Contact and follow Richard on Twitter: @RichardSnowFX
Comments are closed.