Dow Jones, forecast 02/14/2023. – Analytics & Forecasts – 21 February 2023
The fractal structure of the chart with a time frame of 1 Week.

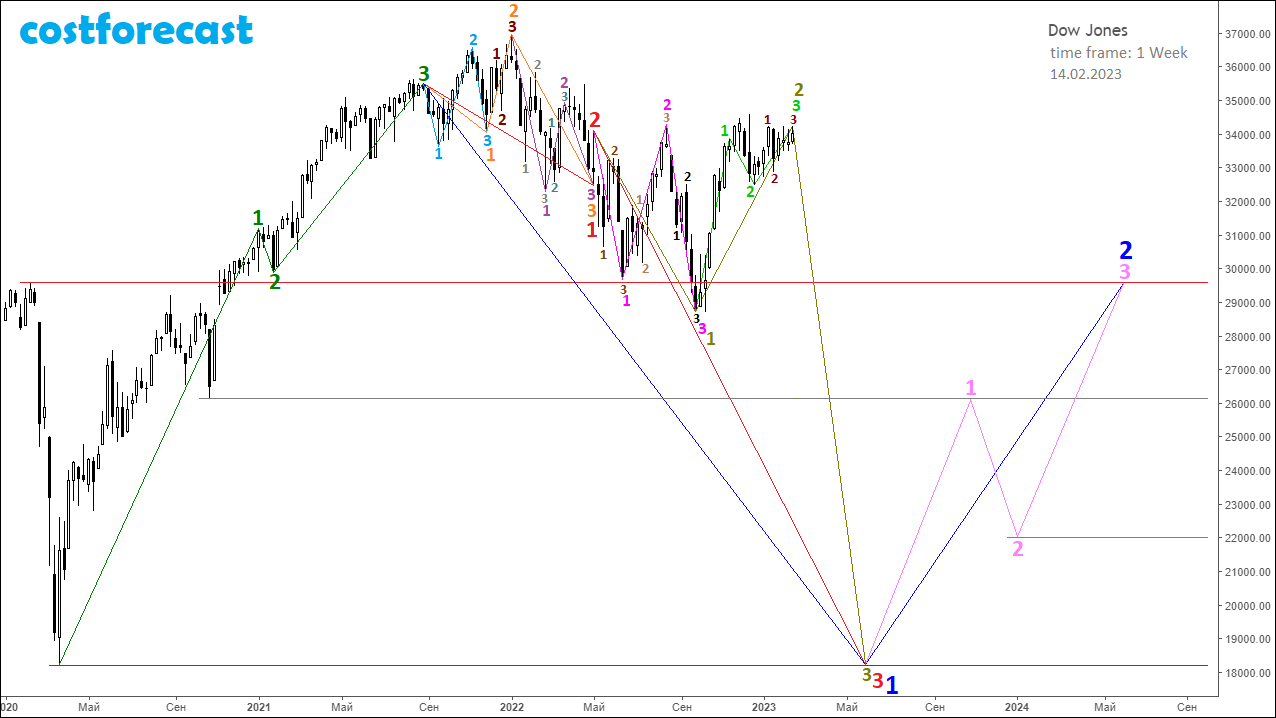
Analyzing the fractal structure formed on the graph of the dynamics of the Dow Jones index, built with a time frame of 1 week as of February 14, 2023, we can assume that the formation of the 1st segment of the fractal occurred on the time interval (09/30/2022; 11/14/2022) , marked in bright green on the graph.
In this case, on the time interval (11/14/2022: 12/19/2022) the 2nd segment of the bright green fractal was formed, and on the time interval (12/19/2022; 02/14/2023) the 3rd segment of this bright green fractal was formed .
As a result, we have that between two points with coordinates (09/30/2022; 28723.55) and (02/14/2023; 34330.89), the 2nd fractal segment of a higher order was formed in the form of a bright green fractal (see numbering of orders in fractal structures), which is indicated by olive color.
At the moment, the most likely scenario is that the future dynamics of the Dow Jones index will take place in a downtrend as part of the formation of the 3rd segment of the olive fractal towards the support level at around 18,000 points.
The 1st segment of the olive fractal was formed on the time interval (05/04/2022; 09/30/2022) in the form of the F23 fractal (see Alphabet of Niro Attractors), indicated in bright pink.
After its completion, the olive fractal will be the 3rd segment of a fractal of a higher order, indicated in red, the 1st segment of which was formed on the time interval (09/02/2021; 05/02/2022) in the form of a fractal, which is indicated in orange, and The 2nd segment of this red fractal formed as a mono-segment on the time interval (05/02/2022; 05/04/2022).
In this case, the collapse of the American stock market will end with the formation in the fractal structure on the graph of the dynamics of the Dow Jones index of the 1st segment of the fractal, marked in blue, which is the F11 fractal (see Alphabet of Niro Attractors), which is marked in red.
The most likely end of the fall of the index may occur at around 18,000 points. However, anything can happen, and with very strong volatility, this support level can be easily broken.


Comments are closed.