Dollar Advance and Uneven Risk Trends Amplify USDMXN, USDHKD, USDINR and USDTRY
Dollar, Emerging Markets, Peso, Hong Kong Dollar, Lira and Rupee Talking Points:
- The Market Perspective: USDHKD Range Bound Below 7.8500
- The charge in risk trends through January has come on hard times recently, leading assets like indices to drop and regions like the EM to ease; in turn EM currencies have been hit
- USDHKD is nearing its enforced range cap, USDMXN put in for a severe 2-day rally, USDINR is near its record high and USDTRY is already there
Recommended by John Kicklighter
Forex for Beginners
In the FX market, most traders focus on the ‘majors’ – the most liquid exchange rates in the world. The depth of market behind the likes of the EURUSD, USDJPY and GBPUSD offers stability and anchors us to a wider degree of systemically important fundamental themes. However, that mix can also translates in more reserved price action and confusion when competing themes murky the forecast. When it comes to the largest emerging market currency crosses, the sacrifice of market depth can translate into a significant increase in volatility – as much a burden as a boon. It also tends to refine the attention to the more liquid currency in the pairing (in the case of this report, the US Dollar) and typically anchors the impact on ‘risk trends’. In the case of the four crosses below, both of these matters are true; but there is some interesting nuance for each.
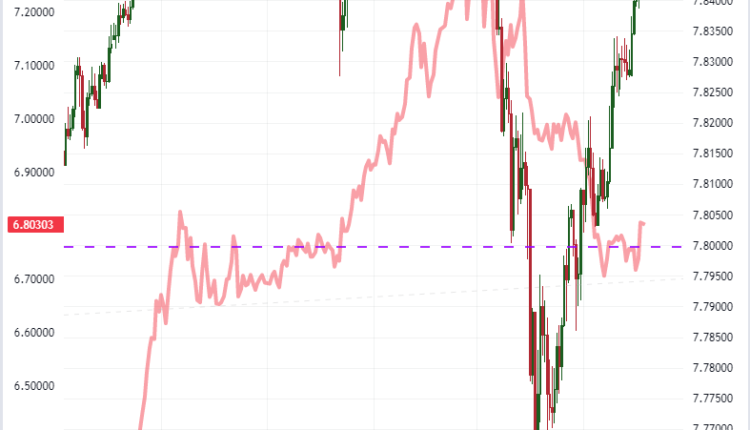
The first ‘EM’ cross I’d like to highlight is the US Dollar – Hong Kong Dollar pairing (USDHKD). With China’s incorporating the island nation as a ‘special administrative region of China’, this exchange rate should theoretically shadow the influence of USDCNH (the offshore Chinese Yuan). It shouldn’t be a perfect mirror, but the influence of the second largest economy in the world should be a rudder for the currency that is often considered a financial hub conduit for the region. In reality, the two exchange rates have experienced an extraordinary contrast in performance. While USDCNH has dropped from its multi-year high above 7.3000, there have been phases of decline interspersed with congestion. USDHKD on the other hand dropped unrestrictive from 7.8500 to 7.7600. While the Yuan is still hovering around 6.8000, USDHKD has also reversed directly back to the previous high. In part, this is a reflection of the ceiling on the fixed trading band around the cross, but it is also a suggestion that the USDCNH exchange rate is not fully market-determined.
Chart of USDHKD Overlaid with USDCNH (Daily)
Chart Created on Tradingview Platform
In contrast to the Hong Kong Dollar, the Mexican Peso is an unrestricted market-determined exchange rate with the US Dollar. What’s more, the ‘North American’ aspect of the two currencies helps moderate its trend development as the performance of the larger economy is considered a critical guide for the health of its neighbor to the south. Nonetheless, the swell in the Greenback between the risk aversion and a rebound in Fed interest rate expectations has found a stronger counterpart in this ‘just out of the majors’ peer. In fact, the 2-day rate of change for USDMXN jumped 2.7 percent, the biggest charge since December 5th and then June 14th before it. The move would also clear the 20-day simple moving average. From a fundamental perspective, the intensity of the risk winds are not as severe, but there are also not many high profile Mexican events on the calendar ahead.
Chart of USDMXN with 20-Day SMA Overlaid with ROC and Spot-20-Day SMA Disparity (Daily)

Chart Created on Tradingview Platform
Another exchange rate that has limited interference from factors outside the market’s collective sentiment but adds back in more of the speculative sensitivity of very different economies is USDINR. The Dollar’s rally has come through on its pairing with the Indian Rupee with a two-day rally that is the biggest since December 6th. Back then, the market was making another strong move to test the record high that has been set back in October. We would ultimately hold the line at that roughly 83.00 level. Will we be put to the test once again? We are within easy reach of that same level as of Monday’s close. Notably, this cross did not retreat nearly as much as other risk-oriented measures like global indices. If risk aversion hardens, it would not be difficult to imagine new record highs.
Chart of USDINR with 50, 100 and 200-Day SMA (Daily)
Chart Created on Tradingview Platform
Speaking of record highs USDTRY (US Dollar – Turkish Lira) has printed yet another fresh peak this past session. You may notice that the rate of volatility over the medium-term (60-day ATR) has significantly deflated over the past six months. That is owing to the step up in intervention on behalf of Turkish officials. It is hard to determine just what would happen to this exchange rate if the market were unencumbered, but the fact that there haven’t been any meaningful moves lower (either volatility or trend) suggest we are not where the market would itself determine equilibrium.
Chart of USDTRY with 50 and 100-day SMA, 60-Day ATR, Spot-100 Day Disparity (Daily)

Chart Created on Tradingview Platform


Comments are closed.