Dismal December Retail Sales Leads Cable Lower
GBP/USD News and Analysis
- Disappointing retail sales during a strike affected December poses concerns for shoppers
- GBP/USD eases after the report, heading into the weekend looking for support at 1.2300
- Attention turns to next week with the first look at US GDP and PCE inflation data, UK PMIs too
- The analysis in this article makes use of chart patterns and key support and resistance levels. For more information visit our comprehensive education library
Recommended by Richard Snow
See what our analysts foresee in sterling for Q1
Disappointing December Retail Sales Data
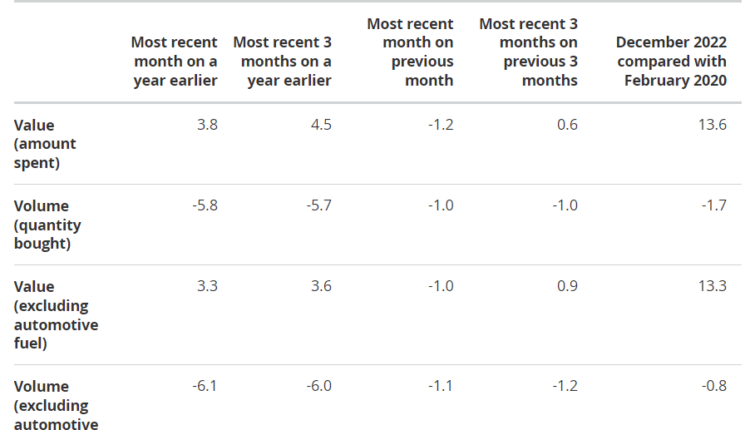
Retail sales volumes have fallen 1% from November, indicating a challenging environment for consumers amid the ongoing cost of living squeeze. The monthly data declined in terms of value spent (value is an indication of price rises) as well as quantity bought. Longer term trends reveal that value spent is considerably higher while volumes purchased decline – which is consistent with the current inflationary environment as consumers spend more for less.
In fact, volumes were 1.7% below February 2020 levels and anecdotal evidence advanced by the report suggests that the decrease in online sales was partly attributed to the Royal Mail strikes as consumers opted for in store shopping instead.
Source: Office for National Statistics (ONS), prepared by Richard Snow
GBP/USD Eases into the Weekend after a Period of Steady Appreciation
The GBP/USD weekly chart reveals what appears to be an inverse head and shoulders pattern. The head and shoulders pattern is widely viewed as a major reversal pattern and, should that be the case for cable, it may see the pair climb even higher in the coming weeks/months.
The neckline remains the first hurdle and price action this week has refused a test of the level – heading lower before the weekend.
GBP/USD Weekly Chart

Source: TradingView, prepared by Richard Snow
The daily chart reveals more granular price action as the pair retreats from that neckline level, back towards the zone of support around 1.2300. From here, bulls will be looking to find support and a bounce higher into next week – which could be helped if US GDP disappoints. Upon a potential move above the neckline, there is often a propensity for prices to then test the neckline (this time as support) before another leg higher. Thereafter, 1.2676 comes into play as a further resistance level.
Support as mentioned lies at 1.2300, followed by the psychological level of 1.2000 which is a fair distance away from current levels.
GBP/USD Daily Chart
Source: TradingView, prepared by Richard Snow
Major Risk Events for the Week Ahead
Today is fairly quiet on the economic calendar apart from developments from the Davos economic forum and Fed speak (Waller, Harker). Next week however, we get the first look at US GDP data which is central to the ‘soft landing’ outcome that the Fed has been hoping for as it continues to tighten financial conditions to bring inflation down. Markets had expected less tightening from the Fed after US retail sales revealed the lowest level of activity in the last 12 months but that was before the Fed’s James Bullard all but disregarded the encouraging inflation prints, suggesting the Fed get to a policy rate of 5% before considering the data. US PCE will also be greatly anticipated as the Fed’s preferred measure of inflation.

Customize and filter live economic data via our DailyFX economic calendar
— Written by Richard Snow for DailyFX.com
Contact and follow Richard on Twitter: @RichardSnowFX


Comments are closed.