Daily Forex News and Watchlist: EUR/CHF
The euro zone just printed weaker than expected PMI figures!
Can these be enough to spur a triangle breakdown on EUR/CHF?
Before moving on, ICYMI, I’ve listed the potential economic catalysts that you need to watch out for this week. Check them out before you place your first trades today!
And now for the headlines that rocked the markets in the last trading sessions:
Fresh Market Headlines & Economic Data:
Japanese flash manufacturing PMI fell from 48.4 to 48.1 in July to reflect sharper contraction vs. projected improvement to 50.1
Australia’s flash manufacturing PMI improved from 48.2 to 49.1 while services PMI fell from 50.3 to 48.0 in July
French flash manufacturing PMI slipped from 46.0 to 44.5 to signal sharper contraction vs. estimated 46.1 figure, services PMI dipped from 48.0 to 47.4 vs. 48.5 forecast in July
German flash manufacturing PMI tumbled from 40.6 to 38.8 in July to reflect faster pace of contraction vs. 40.9 consensus, services PMI down from 54.1 to 52.0 to indicate slower growth
Price Action News

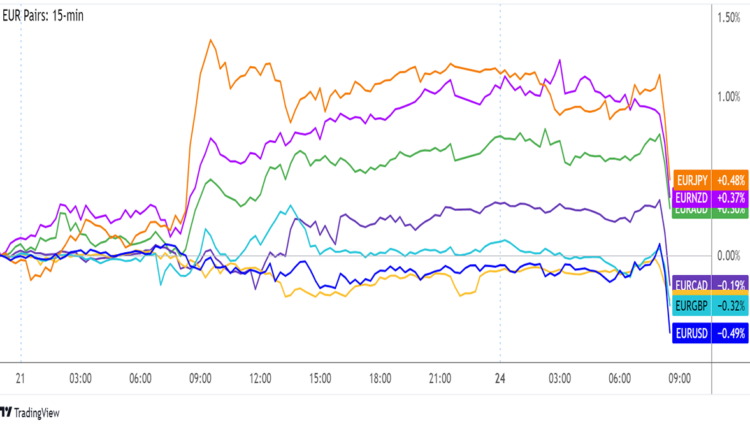
Overlay of EUR Pairs: 15-min
Most major forex pairs were stuck in consolidation during the first few trading hours of the week, as traders likely braced themselves ahead of top-tier events lined up.
However, the euro staged a sharp breakdown when flash PMI readings from Germany and France pointed to much weaker than expected activity in both services and manufacturing sectors.
Prior to this, Japan also printed a disappointing manufacturing PMI while figures from Australia came in mixed.
U.K. flash manufacturing and services PMIs at 9:00 am GMT
U.S. flash manufacturing and services PMIs at 1:45 pm GMT
Use our new Currency Heat Map to quickly see a visual overview of the forex market’s price action! 🔥 🗺️

EUR/CHF 1-hour Forex Chart by TV
Thanks to downbeat eurozone flash PMI readings, EUR/CHF is in selloff mode and is closing in on the bottom of its descending triangle pattern.
Risk-off flows also seem to have kicked in after other economies like Australia and Japan released weaker than expected reports as well. With that, the Swiss franc might be in for more gains ahead.
In that case, this pair might attempt to break below its triangle bottom around the .9610 area and go for a dip to the next support levels at S1 (.9590) or S2 (.9560).
Note that the chart pattern spans approximately 100 pips in height, so the resulting breakdown could be of the same height. Just keep in mind that EUR/CHF moves roughly 45.4 pips per day based on its average daily volatility.
If support holds, on the other hand, the pair might still bounce back up to the triangle top that lines up with the pivot point (.9640) or even attempt a break higher.


Comments are closed.