

Crude Oil, WTI, Retail Trader Positioning, Technical Analysis – IGCS Commodities Update
- Crude oil prices have rallied over 17 percent since bottoming
- Retail traders now majority short for the first time since April
- This hints at an increasingly bullish contrarian conviction
Recommended by Daniel Dubrovsky
Get Your Free Oil Forecast
Crude Oil Sentiment Outlook – Bullish
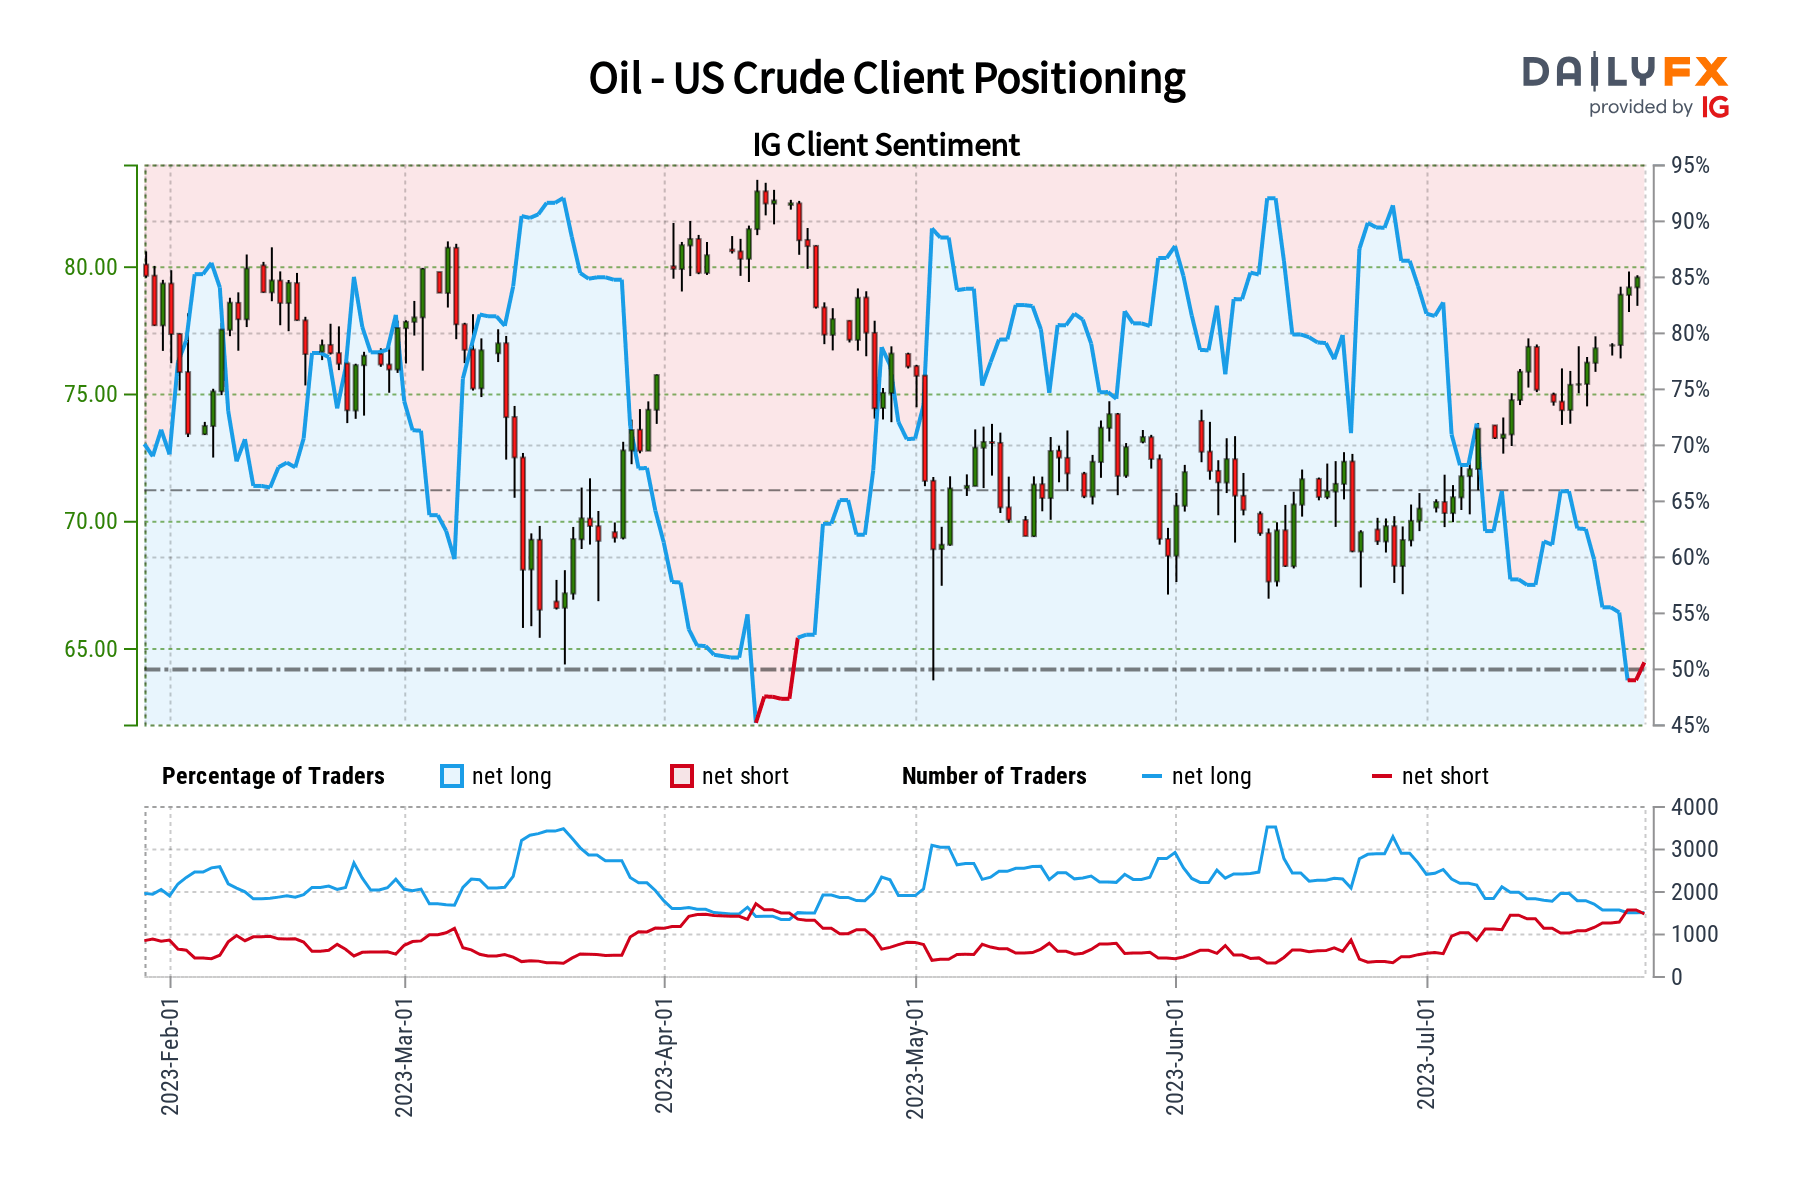
Crude oil prices have rallied over 17 percent since bottoming in the middle of June. So far this month, WTI is up over 13%. If gains are sustained, this would mark the best 20-day period for oil since January 2022. In response, retail traders have continued to increase downside exposure. This can be seen by looking at IG Client Sentiment (IGCS), which tends to function as a contrarian indicator.
The IG Client Sentiment (IGCS) gauge shows that about 47% of retail traders are now net-long crude oil. This is the first time the majority has been biased to the downside since April. Due to this change in bias, the gauge hints that prices may continue rising.
This is as downside exposure has increased by 7.73% and 44.89% compared to yesterday and last week, respectively. With that in mind, the combination of overall positioning and recent changes produces a stronger bullish contrarian trading bias.
WTI crude oil prices have confirmed a breakout above the 200-day Moving Average (MA). This is increasingly indicating that a longer-term shift in orientation might be taking shape. That said, there remains a notable obstacle ahead. That would be the 81.44 – 83.48 resistance zone. If this range holds and prices pivot lower, this would introduce a neutral technical bias.
In such an instance, a rectangular trading pattern could emerge as prices fall back to the 63.60 – 65.72 support zone. But, getting there would entail keeping a close eye on the near-term rising support line from late June – the red line on the daily chart below. Otherwise, continuing higher from here places the focus further beyond to the 92.43 – 93.72 resistance zone from November.
Recommended by Daniel Dubrovsky
How to Trade Oil
Crude Oil Daily Chart
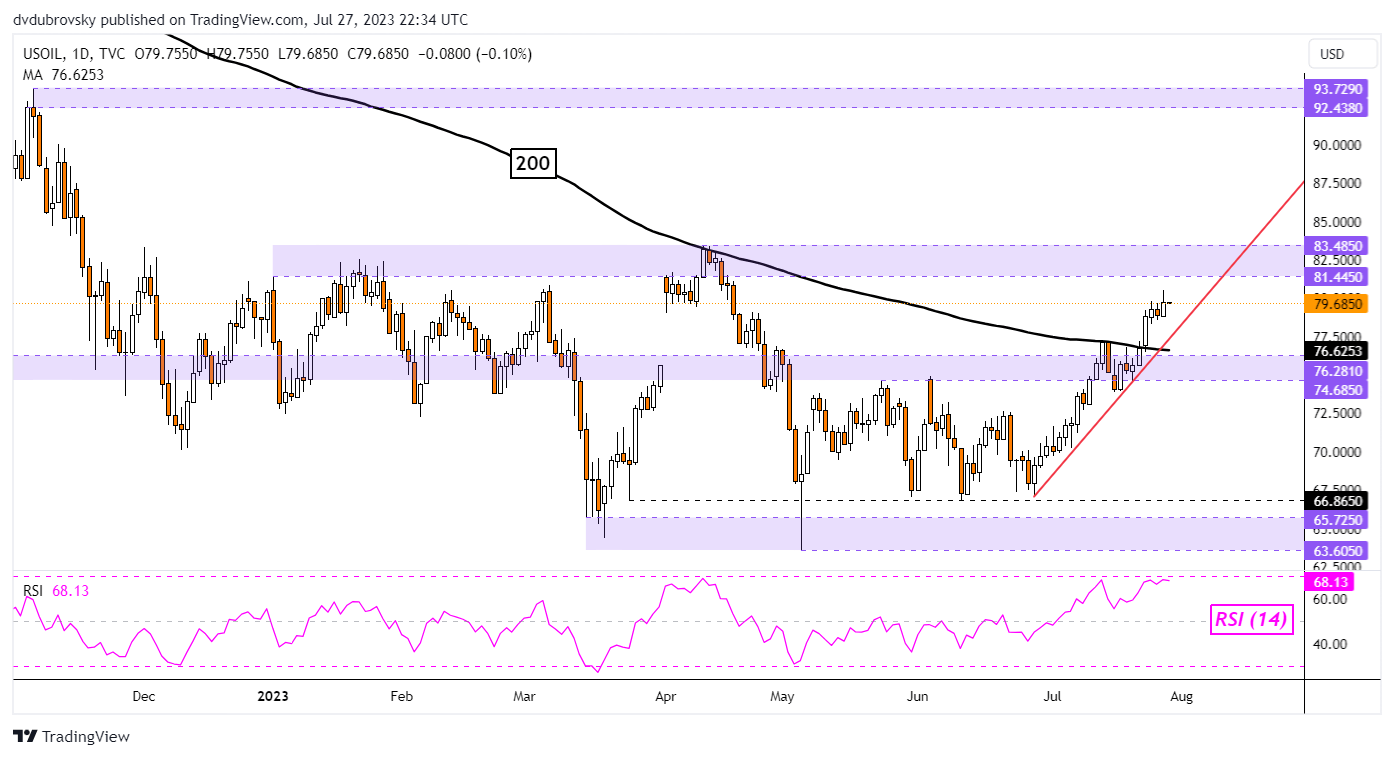
Chart Created in Trading View
— Written by Daniel Dubrovsky, Senior Strategist for DailyFX.com
Comments are closed.