

CRUDE OIL, WTI – Technical Outlook:
- Crude oil’s initial rebound following the output cut announcement has stalled.
- Demand concerns could be weighing on sentiment.
- What is the outlook and what are the key levels to watch?
Recommended by Manish Jaradi
How to Trade Oil
Oil prices haven’t been able to extend gains after the initial jump following the surprise announcement of the output cut by OPEC+ producers. There could be a couple of reasons for the wait-and-watch mode.
The modest rebound in China’s economic growth suggests the recovery could be delayed there, just as other economies risk a recession. If energy prices rise further, it would complicate central banks’ efforts to curb inflation, posing further headwinds for the global economy. Put together, the prospect of lower oil demand can’t be ruled out. Another key factor to watch would be to what extent the group exercises compliance with the agreement. Full implementation could take time to play out.
Crude Oil Daily Chart
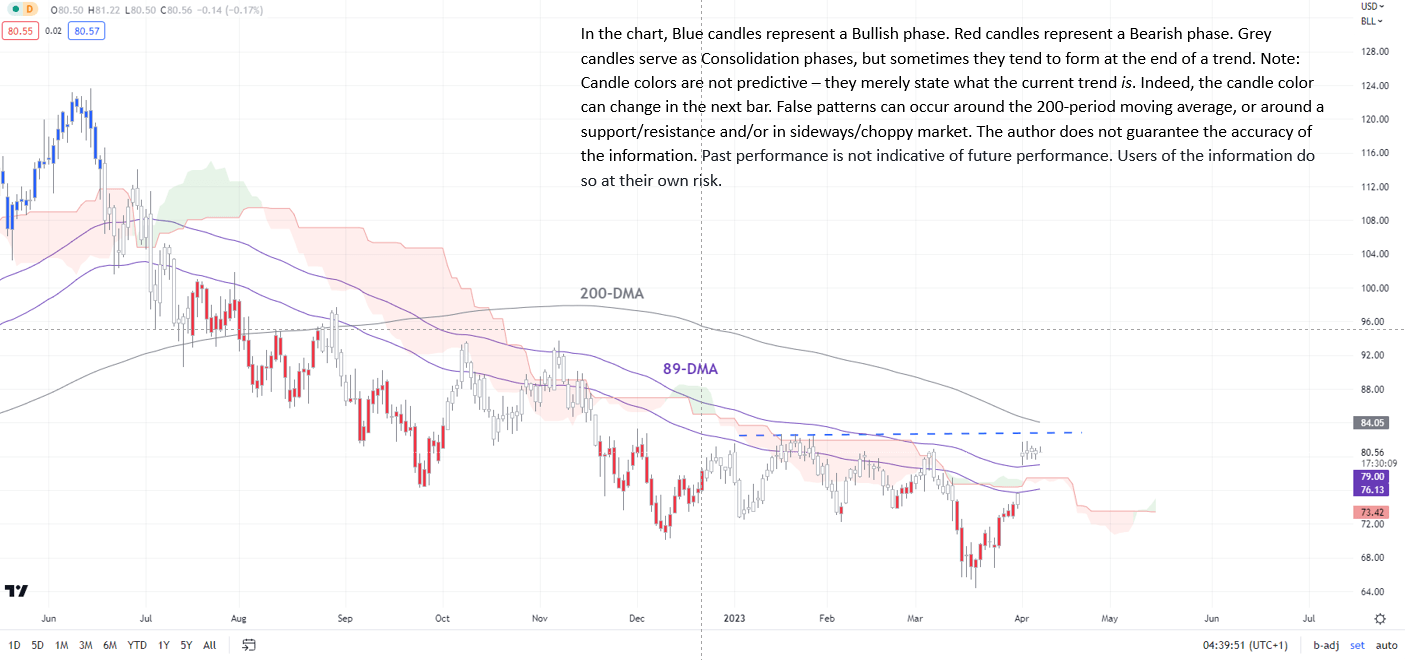
Chart Created by Manish Jaradi Using TradingView
This comes as crude oil tests crucial converged resistance at 82.50-84.50, including the 200-day moving average and the January high. Oil would need to break above the crucial barrier for the nine-month-long downward pressure to fade. A decisive break above 82.50-84.50 could open the way toward the November high of 93.75.
So far, the rally appears to be corrective within a bearish phase, as the colour-coded candlestick chart based on trend/momentum indicators suggests. Moreover, the 14-week Relative Strength Index has been capped around 50-55 — corrective rallies often tend to run out of steam around 50-55.
Crude Oil Weekly Chart
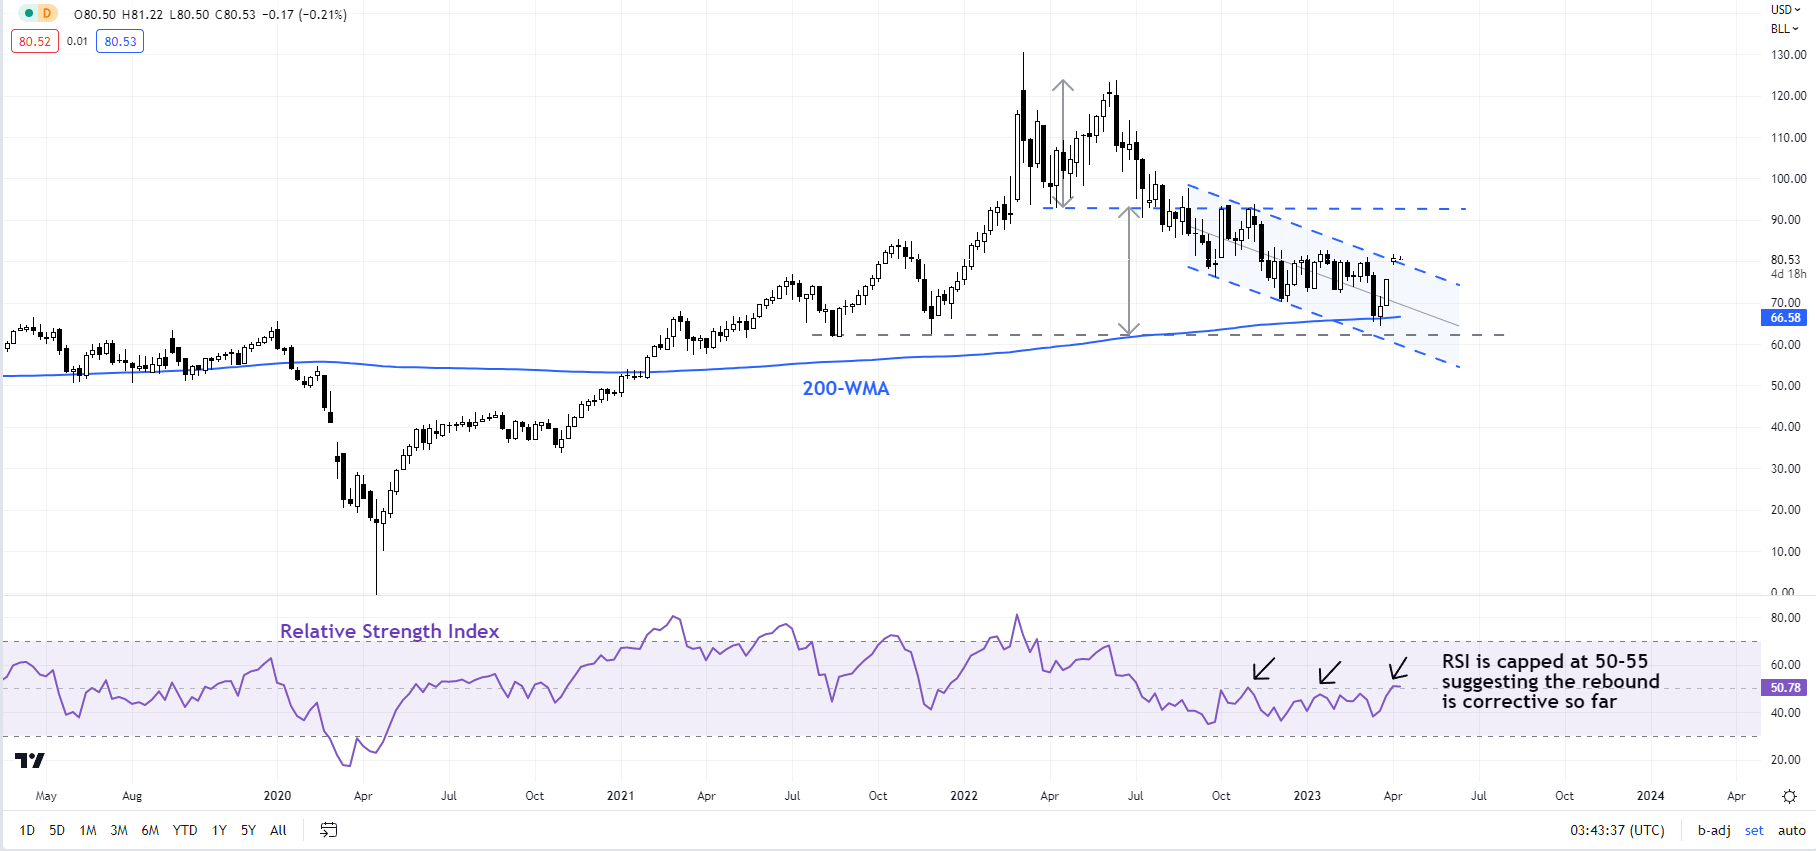
Chart Created by Manish Jaradi Using TradingView
On the downside, the upper edge of last weekend’s gap (at about 79.00) is initial support, while the lower edge of the gap (around 75.50) is secondary support. If the bullish gap is closed, it would raise the odds that the rebound since late March was a dead-cat bounce.
Crude Oil 240-minute Chart
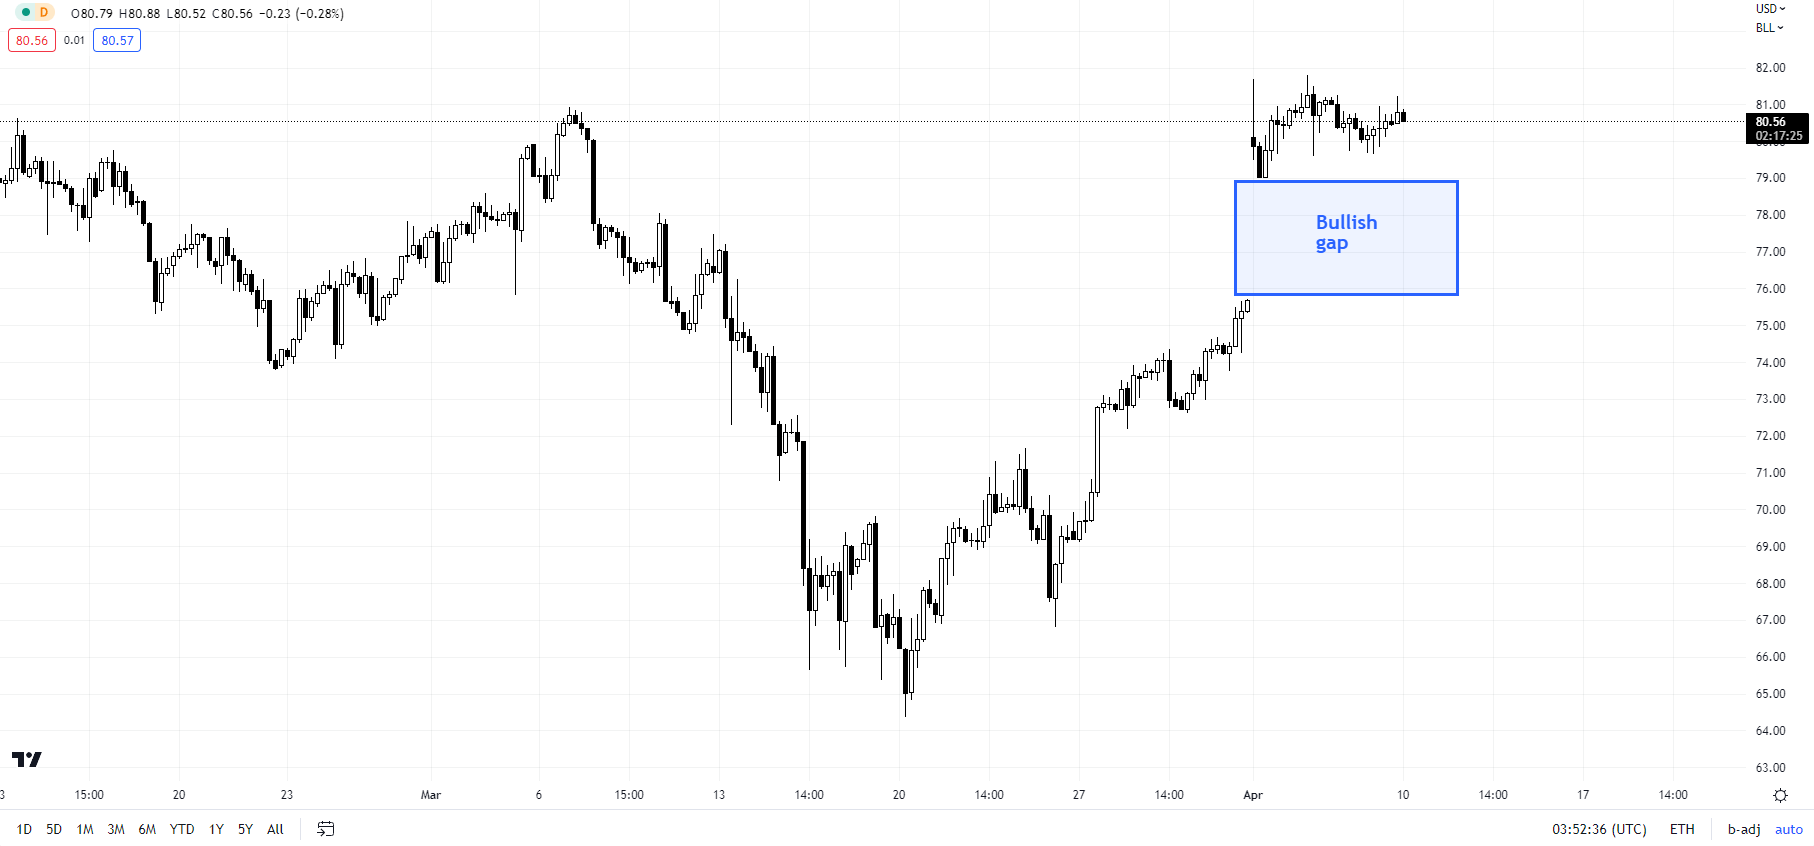
Chart Created by Manish Jaradi Using TradingView
Oil rebounded in March from quite a strong cushion on the 200-week moving average, near the August 2021 low of 61.75.
Trade Smarter – Sign up for the DailyFX Newsletter
Receive timely and compelling market commentary from the DailyFX team
Subscribe to Newsletter
— Written by Manish Jaradi, Strategist for DailyFX.com
— Contact and follow Jaradi on Twitter: @JaradiManish
Comments are closed.