Copper Prices Drop on Weaker Chinese Data, Demand Concerns
Copper News and Analysis
- Soft Chinese data and reduced copper demand brings recovery into question
- Technical levels to consider when analysing the potential for a bearish continuation for copper
- The analysis in this article makes use of chart patterns and key support and resistance levels. For more information visit our comprehensive education library
Recommended by Richard Snow
Read through the top Q2 trades identified by our analysts
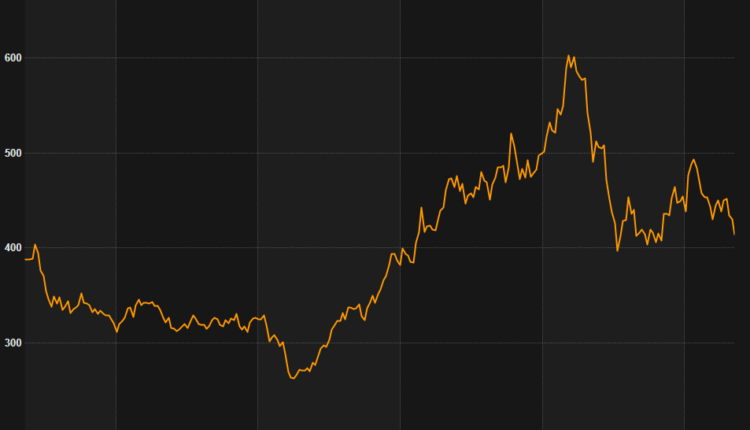
Copper is often looked at as a leading economic indicator as demand for the metal rises during an economic expansion and falls during a downturn. Copper is singled out, but similar inferences can be made when looking at a benchmark of broad industrial metals such as the S&P GSCI Industrial Metals Index, seen below.
S&P GSCI Industrial Metals Daily Chart
Source: Refinitiv, prepared by Richard Snow
After enjoying a massive bull trend at during the global recovery and reopening, metal prices stabilized but have turned lower once more.
Softer Chinese Data and Reduced Copper Demand Brings Recovery into Question
Copper prices fell this week after China announced less than stellar import and export data. On Wednesday, China revealed that its imports contracted sharply in April while exports rose at a more sluggish pace, revealing that the reopening of the world’s second largest economy isn’t quite having the effect analysts had hoped for. In addition, Chinese demand for copper has been falling which may be in response to the decline in aggregate demand that is currently taking place as major economies continue to experience declining growth in a high interest rate environment.
Technical Levels to Watch for Copper
Copper prices have been hinting at a sharper move lower for some time now, waiting for a catalyst. Since topping out in January this year, prices have been in decline, making lower highs and, for the most part, lower lows.
The recent move lower showed some follow through with yesterday’s declines adding to Wednesday’s drop. 8442 was passed with relative ease, sending prices down to the next level of support around 8188, where prices appear to have found some support ahead of the weekend. If the bearish move has further to go, a close below 8188 would naturally bring 7865 into focus as the next zone of support.
Given the large selloff, it’s not surprising that the RSI has flashed the ‘oversold’ signal – often leading to a shorter-term pullback before traders evaluate the next move. Resistance appears at the prior level of support, at 8442.
Daily Copper Chart (IG)

Source: IG, prepared by Richard Snow
— Written by Richard Snow for DailyFX.com
Contact and follow Richard on Twitter: @RichardSnowFX


Comments are closed.