Commodities Watchlist: Short-Term Correction on Gold (XAU/USD)
This precious metal has been on a tear recently, and I’m seeing an opportunity to catch a quick pullback!
Here are the support levels I’m watching on gold.

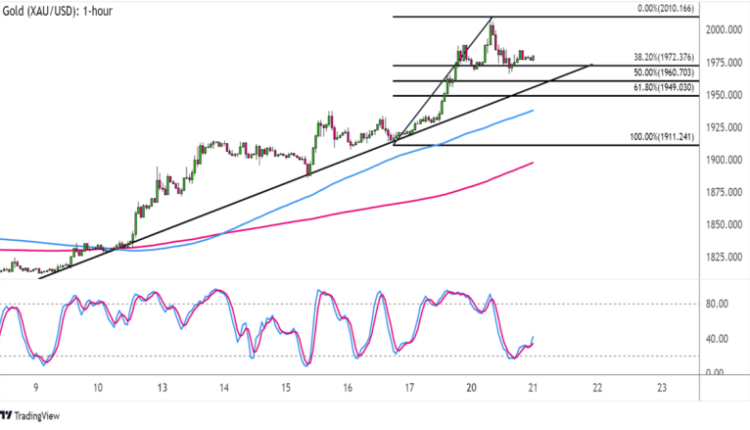
Gold (XAU/USD) 1-hour Chart by TradingView
I’ve got gold’s long-term bullish breakout on my radar, so I’m looking for a chance to hop in the rally.
On the hourly time frame, XAU/USD is trading above an ascending trend line that’s been holding since early this month.
It looks like another test of the support zone is in the works, and the handy-dandy Fib tool shows where more gold bugs might be waiting.
The 50% level might be a good level to enter a long position since this lines up with the trend line at $1,960. A larger pullback could reach the 61.8% Fib at the $1,950 minor psychological mark.
However, the 38.2% level already seems to be attracting buyers while Stochastic is starting to pull higher from the oversold region. A bit of bullish divergence can also be seen, as the oscillator formed lower lows while the price had higher lows.
Moving averages are pointing to a continuation of the uptrend as well, with the 100 SMA safely above the 200 SMA.
If any of the Fibs hold as a floor, gold could resume the climb to the swing high at $2,010 and beyond!
This might just be the case if risk aversion extends its stay in the markets, especially while traders remain on edge about a potential financial sector collapse stemming from the recent bank runs.
How much higher do you think gold can go from here?
This content is strictly for informational purposes only and does not constitute as investment advice. Trading any financial market involves risk. Please read our Risk Disclosure to make sure you understand the risks involved.


Comments are closed.