Commodities Watchlist: Gold (XAU/USD) Bullish Breakout and Continuation?
Heads up, gold bugs!
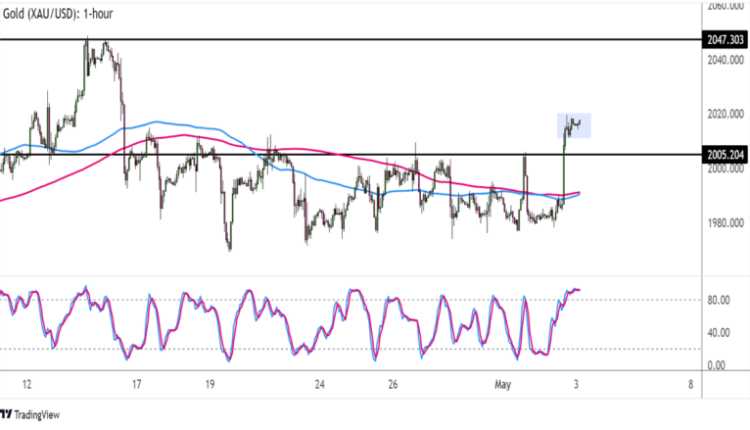
The precious metal landed back above the key $2,000 level, hinting that the tide is turning back in favor of bulls.
To top it off, I’m seeing a bullish flag pattern, pointing to a continuation of the upside move.
Just how high can XAU/USD go from here?

Gold (XAU/USD) 1-hour Chart by TV
The flag’s mast spans around $1,980 to $2,020 which means that an upside breakout could spur a rally of the same height. That should take gold up to around $2,060 or higher.
However, I’m also seeing a nearby barrier at last month’s highs near $2,045, so we might see a bit of resistance right there.
Don’t forget that Stochastic is already indicating overbought conditions or exhaustion among buyers, which could lead to profit-taking pretty soon.
Meanwhile, moving averages are oscillating for now, but it looks like the 100 SMA is attempting another bullish crossover.
Things aren’t looking so good for the U.S. dollar right now since the upcoming FOMC decision is expected to hint at a tightening pause later on while Friday’s NFP release might finally confirm a slowdown in the jobs market.
These might highlight the safe-haven appeal of gold, especially if risk-off flows extend their stay in the financial markets. After all, U.S. banking sector troubles aren’t doing the scrilla any favors right now, too!
This content is strictly for informational purposes only and does not constitute as investment advice. Trading any financial market involves risk. Please read our Risk Disclosure to make sure you understand the risks involved.


Comments are closed.