Chart Art: Trend Pullback Trade for WTI Oil (USOIL) Prices
U.S. crude oil prices look set to cap the week below their weekly highs!
Are we looking at a reversal in the making?
Or just a regular pullback from a strong move?

WTI Crude Oil (USOIL) 4-hour Chart by TV
If you’ve been tracking crude oil prices lately, then you’ll know that the commodity has been having a good month since busting out of the $70 – $72 range in early July.
This week, it’s risk-taking and a bit of anti-USD move that bumped U.S. crude oil prices higher.
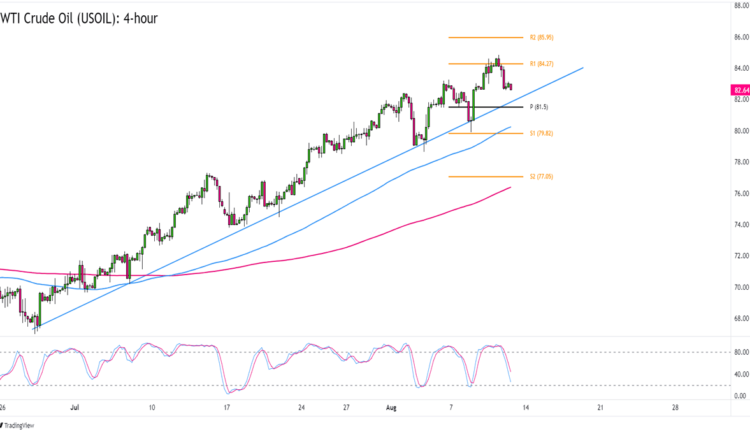
WTI Oil (USOIL) prices are now trading closer to $82.60, much lower than its intraweek highs near $85.00.
Are we looking at a reversal? Or just a short-term pullback?
We’ll get more clues if the asset ever drops to the $82.00 psychological level. As you can see, the area is near a trend line support that’s been holding since early July. Not only that, but it’s also close to the Pivot Point level on the 4-hour time frame.
USOIL buyers can buy at current prices where a previous resistance is, or they can wait for a trend line retest for a better risk ratio.
Not convinced that USOIL can make new highs?
You can also bet on a short trade by placing orders below the trend line or below the S1 support closer to the 4-hour chart’s 100 SMA.
Watch this one closely, yo!


Comments are closed.