Chart Art: Trend and Breakout Setups for Alphabet (GOOGL) And AUD/NZD
Welcome to the last trading day of all 437 days of January!
Whether you’re looking for last-minute trades or you’re setting yourself a strong February, I got yo back with AUD/NZD’s uptrend and Alphabet’s potential breakout.
Don’t even think of missing these setups!

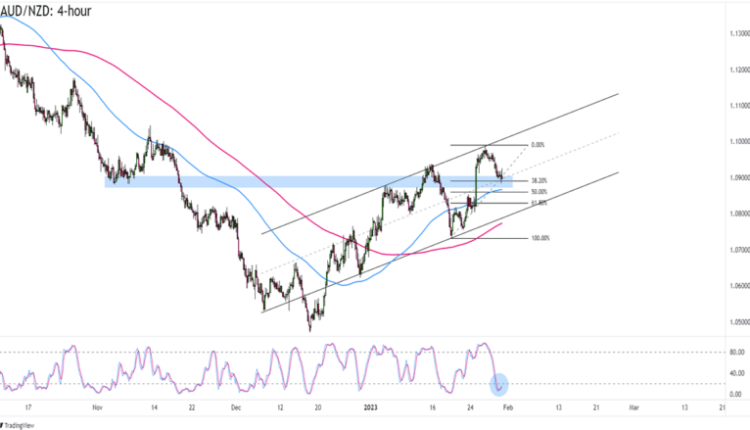
AUD/NZD 4-hour Forex Chart by TradingView
If trends are your friends then it’s time to get acquainted with AUD/NZD’s uptrend.
The pair has been giving us higher highs and higher lows since late December but it wasn’t until early January when the 100 SMA crossed above the 200 SMA and confirmed an uptrend.
AUD/NZD is currently trading at the 1.0900 zone, which lines up with November’s broken support and January’s resistance zones. This time around, it’s also near a mid-channel zone as well as the 38.2% Fibonacci retracement of last week’s uptrend.
Buying at current levels is a good idea if you’re betting on AUD extending its gains against NZD. A bounce from 1.0900 could boost AUD/NZD to its January highs near 1.1000 or even the 1.1120 major area of interest.
If you’re not confident that AUD is ready to bounce just yet, you can also wait for AUD/NZD to hit lower support zones closer to the 100 SMA or channel support before looking for entry opportunities.
Alphabet Inc. (GOOGL): Daily

Alphabet Inc. (GOOGL) Daily Chart by TradingView
Who’s ready to bet on Alphabet?
Google’s parent company is sporting a potential Double Bottom pattern on the daily time frame after a second bounce from the 85.00 area.
Are we looking at an upside breakout in the making? GOOGL is testing the 100 SMA resistance for a second time since it crossed below the 200 SMA in May 2022.
If the stock busts above the 100 SMA and the Double Bottom “neckline” then we could see a jump to the 105.00 area of interest or even the start of a longer-term trip to 120.00 and 125.00 levels.
But if GOOGL traders take their cues from Stochastic‘s “overbought” signal then the stock could get rejected from the 100.00 zone and start a range between 85.00 to 100.00 instead.
Watch this one closely, yo!


Comments are closed.