Chart Art: Trend and Breakout Plays for Bitcoin (BTC/USD) And CHF/JPY
Looking for setups to trade before the trading week ends? I gotchu!
Bitcoin (BTC/USD) is consolidating after an upside breakout while CHF/JPY looks set to extend a weeks-long trend.
Check them out!

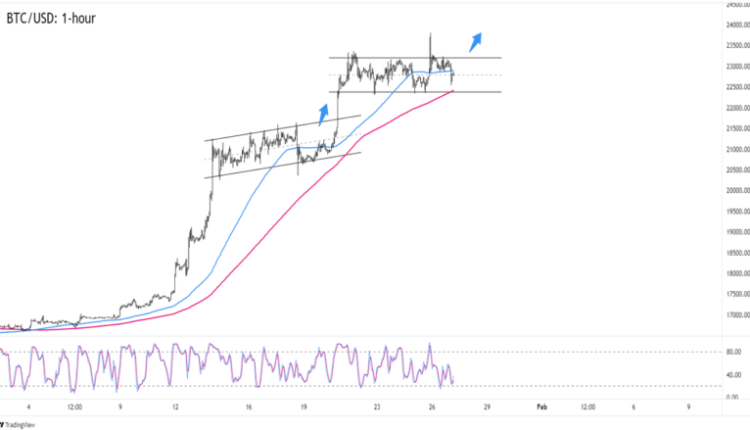
Bitcoin (BTC/USD) 1-hour Crypto Chart by TradingView
The OG crypto has come a long way from its sub-17,000 lows!
BTC/USD is now trading around the 23,000 zone after breaking above an ascending channel pattern last week.
Can BTC bulls keep the party going in the next few days? BTC/USD is stuck inside a range between 22,450 and 23,200 and the 100 SMA is tightening its gap against the longer-term 200 SMA.
Another rejection at the range’s resistance opens Bitcoin to a break below the 200 SMA and a deeper retracement if not a reversal on the 1-hour time frame.
But if BTC/USD manages to make new monthly highs and stay above 23,000 then at least some BTC bulls would start aiming for previous areas of interest like 24,200 and 25,000.

CHF/JPY 4-hour Forex Chart by TradingView
If fiat trading is more your thing, then you should check out CHF/JPY’s potential trend continuation on the 4-hour time frame.
The pair is consolidating just under the 141.00 mark after getting rejected at a descending channel resistance near the 142.00 zone.
What makes the current levels more interesting is that they’re right around the 61.8% Fibonacci retracement of January’s downswing.
Consistent trading below the 100 SMA opens the pair to a drop down to the 139.50 previous support or the 137.50 previous low.
But if the pair extends its late January upswing, then we could see a breakout above the channel and 200 SMA that could take CHF/JPY to previous resistance levels like 143.50 or 145.75.


Comments are closed.