Chart Art: Spot Gold (XAU/USD) And Ether’s (ETH/USD) Fib Retracement Trades
Planning on trading the U.S. dollar but not against other major fiat currencies?
Explore your options with Spot Gold (XAU/USD) and Ether’s (ETH/USD)’s short-term charts!
Check out not one but TWO Fib retracement setups:

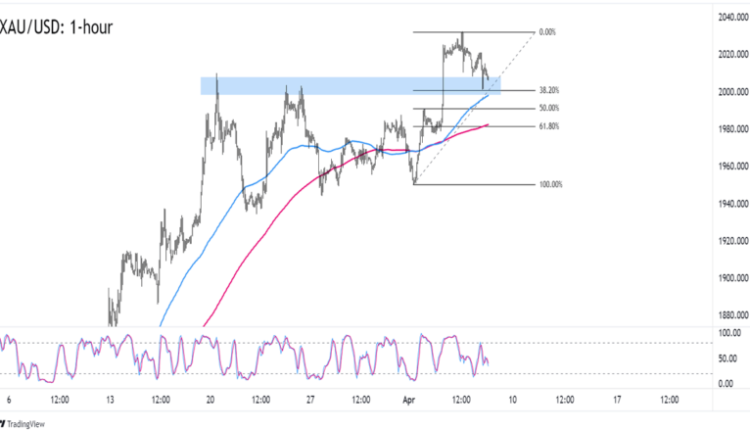
XAU/USD 1-hour Chart
by TradingView[/caption]
After a strong upswing this week, gold bugs found resistance at the $2,030 area.
XAU/USD is now trading closer to the $2,000 psychological handle, which also happens to line up with a resistance from late March this year.
What’s more, XAU/USD’s current prices are also not far from the 38.2% Fibonacci retracement level of April’s upswing AND the 100 SMA on the 1-hour time frame.
Trend warriors can start scaling in at current levels and aim for the previous highs for spot gold prices.
Convinced that the trip to $2,030 was a fluke and that XAU/USD will soon drop even lower?
Look out for a break below the 100 SMA for a potential trip to the $1,980 or $1,950 previous inflection points.
If XAU/USD starts bouncing from its current levels, though, then you gotta be ready for spot gold to potentially revisit its previous highs or even make new monthly highs!

Ether (ETH/USD) 1-hour Chart by TradingView
Hell-er to those who are trading Ether!
The crypto pair climbed from its $1,775 open price area and hit the $1,940 zone before the sellers stepped in.
ETH/USD is now chillin’ at the $1,850 zone, which is not too far from the 38.2% Fibonacci retracement level and the 100 SMA On the 1-hour time frame.
A long trade at current levels would set you up nicely if ETH/USD ends up extending its uptrend and making new highs without revisiting lower pullback levels.
If you’d rather wait for more bullish confirmation, however, then you can also place trades closer to the trend line support or lower Fibonacci levels when jumping on the uptrend.
Good luck and good trading this one!


Comments are closed.