
The yen has been in selloff mode ever since the BOJ renewed its dovish stance.
Can CAD/JPY keep up its climb from here?
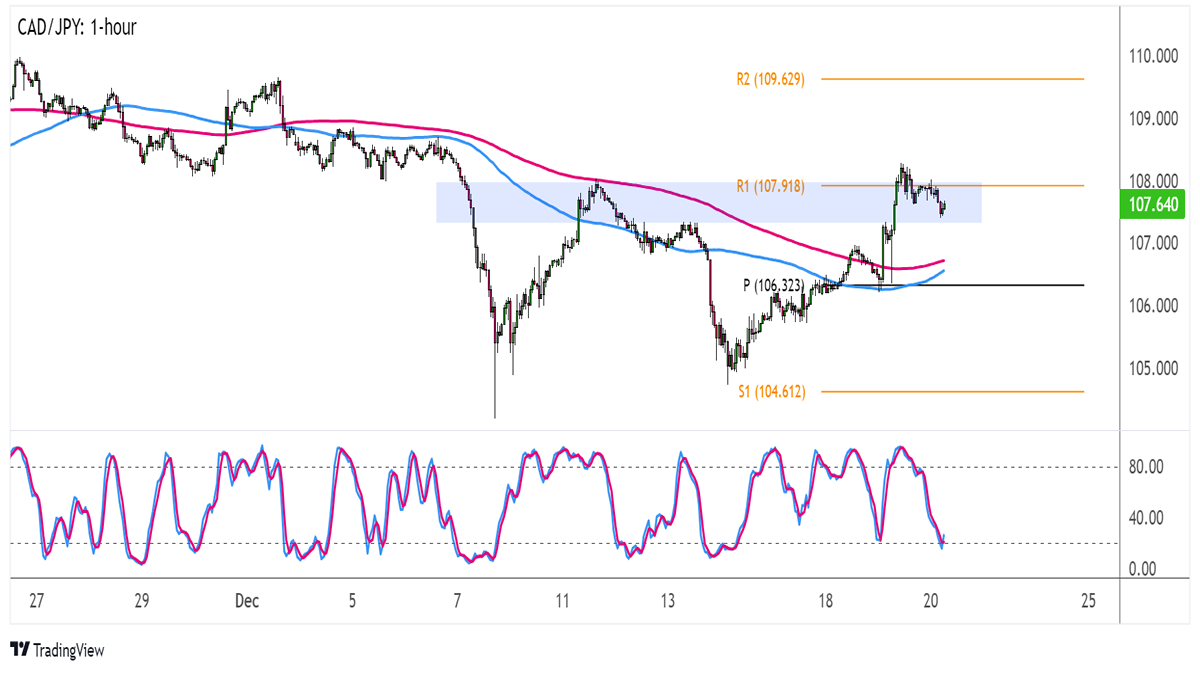
Here’s what I’m seeing on the 1-hour frame:

CAD/JPY 1-hour Forex Chart by TV
Yen pairs popped higher earlier this week when the BOJ refrained from adjusting its current policy and forward guidance.
On the flip side, the Loonie managed to rake in some gains after Canada’s inflation reports all came in stronger than expected. Headline CPI rose another 0.1% month-over-month instead of posting the projected 0.1% dip while the median CPI held steady at 3.4% year-over-year.
Remember that directional biases and volatility conditions in market price are typically driven by fundamentals. If you haven’t yet done your fundie homework on the British pound and the Canadian dollar, then it’s time to do some work by checking out the forex calendar and stay updated on daily fundamental news!
CAD/JPY was able to climb back to the resistance around the 108.00 major psychological mark to complete a double bottom pattern. Watch out for a rally that’s the same height as the formation or roughly 350 pips if the pair breaks above the neckline and R1 (107.92).
Technical indicators are looking mixed for now, as Stochastic is pointing to seller exhaustion and a possible pickup in bullish pressure. However, the 100 SMA is still below the 200 SMA to indicate selling momentum.
If resistance holds, CAD/JPY might still dip to nearby support zones at the pivot point level (106.32) or S1 (104.61) at the bottoms.
Then again, the gap between the moving averages is narrowing to suggest weakening bearish vibes and a potential bullish crossover that could attract more Loonie bulls.
Comments are closed.