Chart Art: Potential Resistance for WTI Crude Oil (USOIL)
U.S. crude oil prices are knocking on a key resistance zone!
Will WTI crude see another setback today? Or will the commodity see new weekly highs before the week ends?
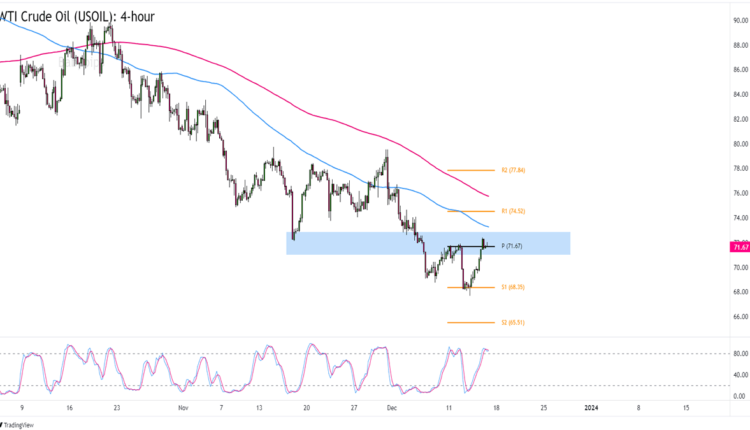
Let’s check out this 4-hour chart:

WTI Crude Oil (USOIL) 4-hour Chart by TV
In case you were too busy trading major forex pairs, you should know that WTI crude oil joined the anti-USD party and bounced higher this week.
Remember that directional biases and volatility conditions in market price are typically driven by fundamentals. If you haven’t yet done your fundie homework on the U.S. dollar and the Loonie then it’s time to do some work by checking out the forex calendar and stay updated on daily fundamental news!
WTI crude oil (USOIL) found support from the S1 ($68.35) Pivot Point line and is now trading closer to the actual Pivot Point line ($71.67).
WTI caught our attention because not only is the $72.00 psychological area closer to this week’s intraweek highs but it also lines up with mid-November’s support. Notably, it’s also not too far from the 100 SMA in the 4-hour time frame.
Think we’ll see an upside breakout in the next few days? Fundamental bears can watch out for clear bullish candlesticks above the Pivot Point line. The R1 ($74.52) resistance may attract profit-takers in case of an upswing but we’re not ruling out a possible test of the 200 SMA.
If your research points you to further losses for USOIL, then you’ll want to watch out for bearish candlesticks and then some momentum below the current $72.00 area.
A trip back to the S1 ($68.35) previous support line is in the cards in case of a rejection at $72.00. We could even see a slow slide to the $66.00 lows if we see fresh fundamental catalysts in the next few days!


Comments are closed.