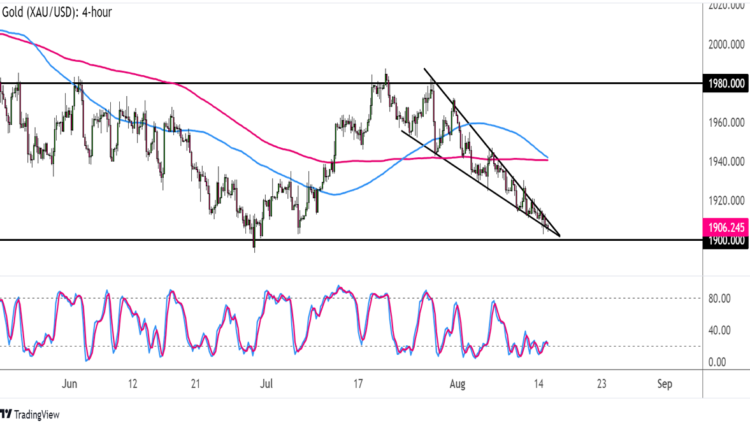
Chart Art: Gold (XAU/USD) Prices Approaching Range Support
Heads up, gold bugs!
The precious metal is closing in on its potential range support, with a consolidation pattern to boot.
Will we see a bounce or a break?

Gold (XAU/USD) 1-hour Chart by TV
As you can see from the hourly chart above, gold prices are inching closer to the $1,900 major psychological level, which has held as a floor in the past months.
Stochastic is also hovering around oversold levels, suggesting that sellers need a break and that buyers might take over from here.
If that’s the case, the commodity could pull up from current levels and set its sights back on nearby upside targets, possibly even until the top of the range around $1,980.
A falling wedge pattern can be seen, as XAU/USD made lower highs and slightly lower lows, so a break above the consolidation resistance might be enough to confirm that gold bulls are charging again.
On the other hand, a break below support could set off a downtrend that’s the same height as the chart pattern.
Don’t forget that the 100 SMA is attempting a bearish crossover from the 200 SMA to suggest that selling action might pick up from here. Just make sure to keep tabs on overall market sentiment and crude oil inventories data when trading this one!


Comments are closed.