
Retracement alert!
After breaking below its double top neckline, gold is pulling up for a quick retest before resuming the downtrend.
Where are XAU/USD sellers looking to hop in?

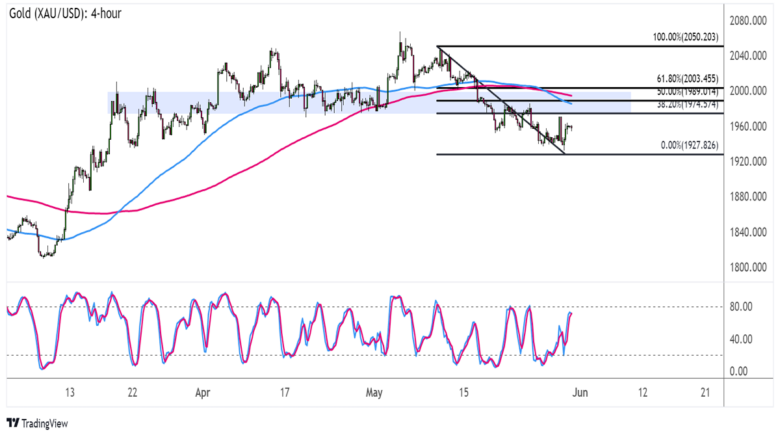
Gold (XAU/USD) 4-hour Chart by TV
Risk-taking and dollar domination seem to be weighing down the safe-haven precious metal these days.
It’s no surprise that these market factors triggered a break below gold’s neckline support around the $2,000 key level, suggesting that more losses might be in the cards.
Before all that happens, though, a quick pullback to the former floor might be needed to draw more sellers out.
The Fibonacci retracement tool shows that this area of interest lines up with the 38.2% to 50% levels, with the latter coinciding with the dynamic resistance at the moving averages.
At the same time, the 100 SMA just made a fresh bearish crossover from the 200 SMA to hint that bearish vibes are returning.
Stochastic has a bit of room to climb before reaching overbought levels, so the correction could keep going until the oscillator reflects exhaustion among gold bulls.
Turning lower could allow the resistance to hold, sending XAU/USD back down to the swing low at $1,927 or lower. Note that the double top spans $1,975 to around $2,050 so the resulting drop could be of the same height.
Do you think gold is bound to head further south from here?
Comments are closed.