Chart Art: Can WTI Crude Oil (USOIL) Still Fill the Gap?
Here’s one for the commodity traders out there!
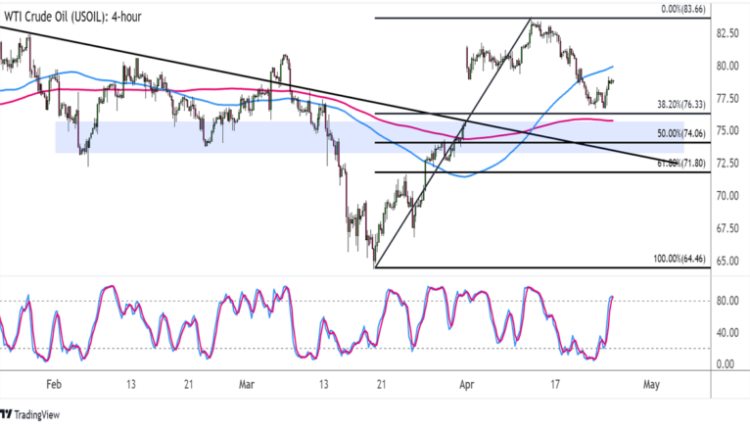
I’m still minding the gap on WTI crude oil, as price seems to be in correction mode. A larger dip could be in the works, possibly taking it down to the nearby Fib levels.
As you can see from the chart below, USOIL has some room to go before reaching March’s closing prices near $75 per barrel.

WTI Crude Oil (USOIL) 4-hour Chart by TradingView
This potential support zone lines up with the 50% Fibonacci retracement level and a former trend line resistance.
If bulls are too eager to charge, crude oil might already bounce off the 38.2% Fib that’s closer to the 200 SMA dynamic inflection point.
A larger correction could reach the 61.8% Fib at $71.80 per barrel, but this might be the line in the sand when it comes to the uptrend reversal.
The 100 SMA is still safely above the 200 SMA to confirm that bullish vibes are present. In that case, the commodity price might soon set its sights back on the swing high at $83.66 per barrel and beyond.
Stochastic is on the move up, too, so price could follow suit while upside momentum is in play. I’d look out for overbought conditions, though!
Apart from the inventory reports by the API and EIA lined up this week, crude oil might also take cues from top-tier U.S. releases, including the advanced GDP and core PCE price index.
After all, these are likely to provide a clearer picture of demand conditions, as well as the outlook for borrowing costs. In particular, stronger economic activity coupled with a lower likelihood for Fed interest rate hikes could mean more upside for fuel and energy commodities.
Don’t forget that upbeat data from China is also lifting risk appetite so far this week, which also translates to bullish prospects for crude oil.


Comments are closed.