Chart Art: Bullish Divergence on Brent Crude Oil (UKOIL) Prices
Brent crude oil prices are down to the bottom of a short-term rising channel.
Will we see a bounce or a break right here?
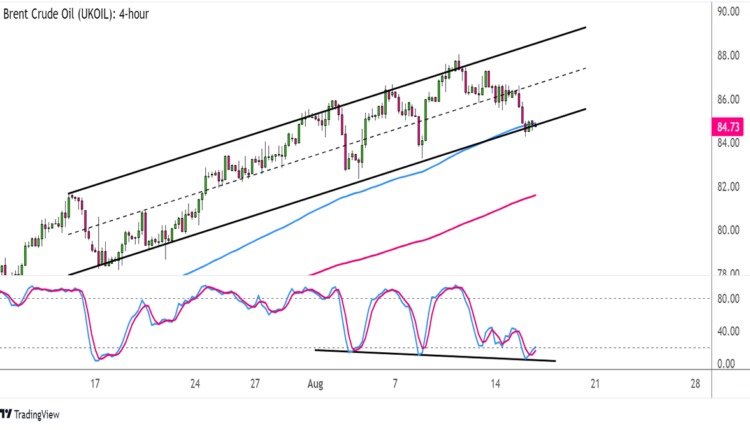
As you can see from the 4-hour chart below, the commodity price has formed higher lows and higher highs connected by an ascending channel that’s been holding since mid-July.

Brent Crude Oil (UKOIL) 4-hour Chart by TV
UKOIL is now testing support around $84.75 per barrel, which happens to line up with the 100 SMA dynamic inflection point.
Now this moving average is above the slower-moving 200 SMA, suggesting that the path of least resistance is to the upside. In other words, the floor is more likely to hold than to break.
In that case, Brent crude oil could make its way back up to the nearby resistance levels, possibly until the channel top at $90 per barrel or at least halfway through at $88 per barrel.
Also keep in mind that the gap between the moving averages is widening, which means that bullish vibes are getting stronger.
To top it off, Stochastic looks ready to pull up from the oversold region to signal a return in upside momentum. That’s after forming lower lows or a bullish divergence with the commodity’s higher lows!
Risk assets might take directional clues from the FOMC meeting minutes due later today, as strong hints about the Fed’s tightening plans could impact investors’ global growth outlook.
Then again, hawkish remarks could be taken with a grain of salt, given how the latest NFP and CPI figures came in mostly below estimates. A more cautious bias among other policymakers could favor higher-yielders like commodities, as the possibility of a September hold could benefit overall economic activity.
Don’t forget to keep tabs on headlines from China, too! After all, another wave of risk-off flows stemming from potential defaults could trigger an uptrend reversal for crude oil.


Comments are closed.