

GBP/USD PRICE, CHARTS and ANALYSIS:
Recommended by Zain Vawda
How to Trade GBP/USD
Most Read: USD/JPY Retreats as 200-Day MA Caps Gains
GBP/USD FUNDAMENTAL BACKDROP
GBPUSD enjoyed a 40-odd pip bounce following the European open before retracing a portion of the move to trade at 1.1875 (at the time of writing). Tuesday’s selloff was followed by consolidation yesterday as markets remain sensitive to high impact data events and central bank commentary.
Markets do seem to lack conviction though as comments by Fed Chair Powell regarding data guiding the Fed decisions seemingly keeping market participants slightly optimistic. However, looking at yesterday’s ADP numbers, it looks like we could be in for another positive NFP print which would then add further credence to a 50bps hike at the upcoming Federal Reserve meeting beginning on 21 March. The dollar index is slightly weaker this morning which is likely to help GBPUSD with a short-term bounce ahead of tomorrow's NFP report and UK GDP data.
Currency Strength Chart: Strongest – JPY, Weakest – USD.
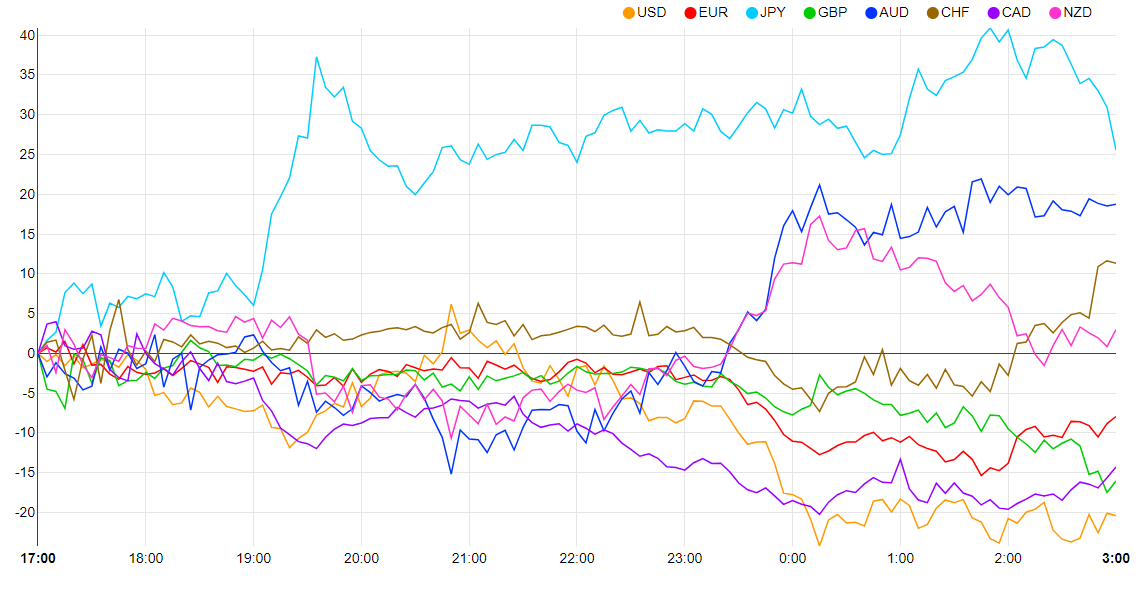
Source: FinancialJuice
The longer-term outlook for GBPUSD does favor further downside however particularly in light of the differing paths the two Central Banks are likely to adopt moving forward. There is speculation that the Bank of England (BoE) could soon pause its hiking cycle while the Fed looks set to continue hiking rates given Fed Chair Powell’s comments this week.
Trade Smarter – Sign up for the DailyFX Newsletter
Receive timely and compelling market commentary from the DailyFX team
Subscribe to Newsletter
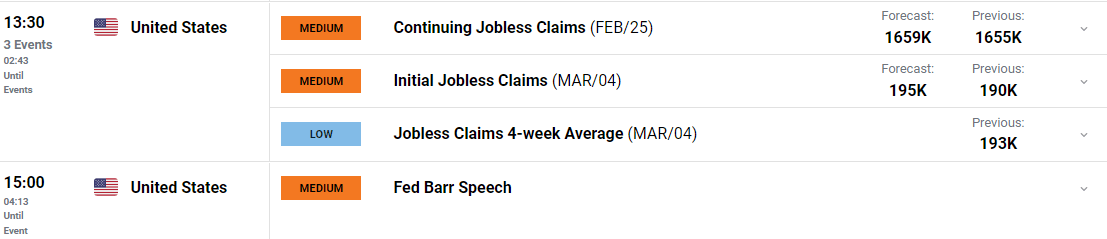
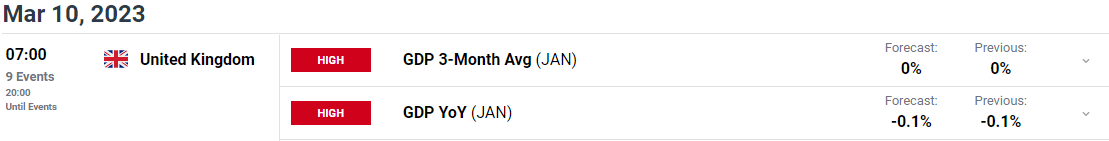
Later today we have initial jobless claims out of the US as well as comments from Fed policymaker Michael Barr as we approach the Feds blackout period. Tomorrow, we have GDP data out of the UK before all focus turns to the NFP report and average hourly earnings which is likely to be key as well given the impact it continues to have on stubborn inflation in the US.

For all market-moving economic releases and events, see the DailyFX Calendar
TECHNICAL OUTLOOK
On the daily timeframe we are currently retesting the 200-day MA and the wedge pattern, having broken below both during Tuesday’s selloff. The 1.1900 level is a short-term resistance area and could cap gains, however a move above here could bring a retest of the 1.2000 psychological level which lines up with the 100-day MA.
Alternatively, a rejection of 1.1900 and a push lower brings resistance turned support at 1.1850 and 1.1800 into play with a daily candle close below the 1.1800-handle opening up a retest of 1.1750 and 1.1650 support areas respectively.
GBP/USD Daily Chart – March 9, 2023
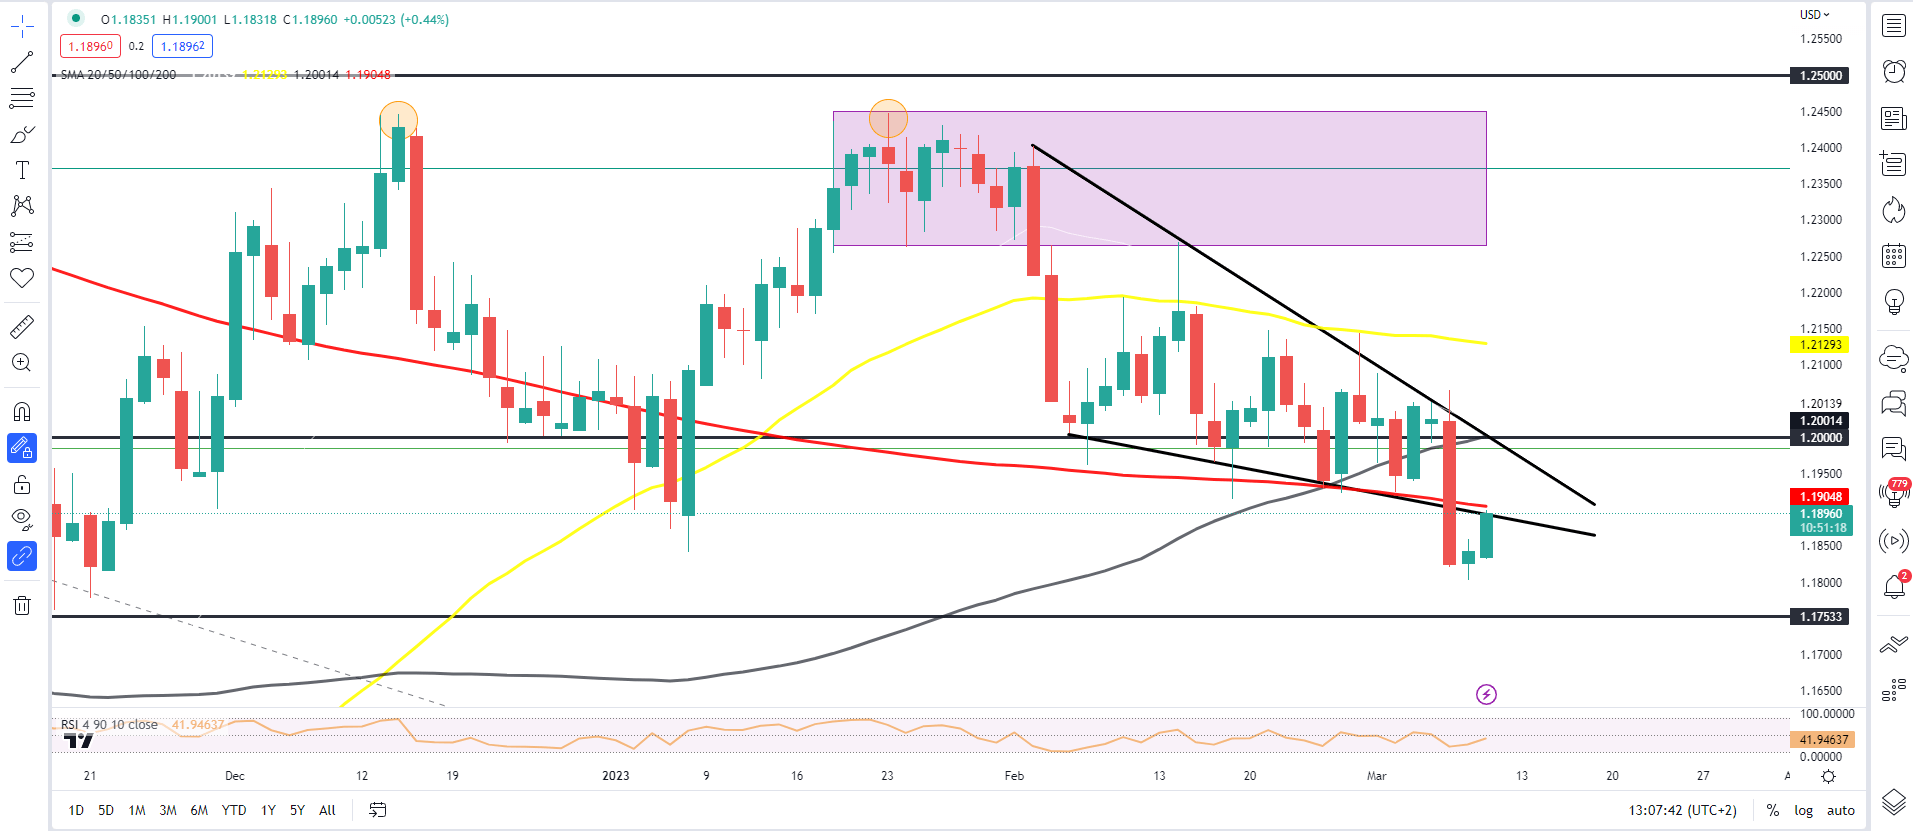
Source: TradingView
Written by: Zain Vawda, Markets Writer for DailyFX.com
Contact and follow Zain on Twitter: @zvawda
Comments are closed.