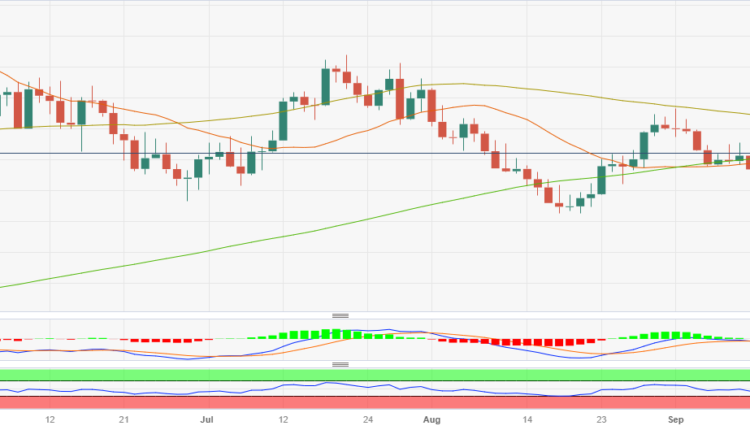
Bulls recovered the 20 and 200-day SMA jumping to $1,923
- XAU/USD tallied 0.60% daily gains and jumped to a daily high of $1,930, then settled at $1,923.
- Bulls quickly recovered the 20 and 200-day SMAs at the $1,920 area after losing them at the beginning of the week.
- Indicators point to a bullish resurgence.
At the end of the week, the Gold Spot price will close a weekly gain, recovering losses, which took the price to a weekly low of $1,900 and closing above $1,920.
Based on the daily chart, the XAU/USD exhibits a bullish outlook for the short term. Both the Relative Strength Index (RSI) and Moving Average Convergence Divergence (MACD) show signs of the buyers recovering and stan in positive territory, with the RSI jumping back above its midline and showing a northward slope. The MACD is also displaying green bars, indicating a strengthening bullish momentum. Additionally, on the four-hour chart, the price jumped above the 20,100 and 200 Simple Moving Averages (SMA) and their indicators also gained significant momentum.
However, on the larger time frame, the spot is well below the 100-day SMA, which suggests that the buyers still have some work to do to confirm a recovery.
Support levels: $1,923 – $1,920 (200 and 20-day SMA), $1,910, $1,900.
Resistance levels: $1,930,$1,940, $1,950 (100-day SMA).
XAU/USD Daily Chart
-638304076955950023.png)


Comments are closed.