Brent Crude Oil Tests Crucial Channel Resistance
Oil (WTI, Brent) Technical Analysis
- Brent crude oil faces another test for continued range trading. Crucial resistance level identified
- WTI prices face test at $73.90. Long-term downtrend has range traders eying bounce lower from here
- The analysis in this article makes use of chart patterns and key support and resistance levels. For more information visit our comprehensive education library
Recommended by Richard Snow
See what our analysts foresee for oil in Q3
Brent Crude Oil Faces Another Test for Continued Range Trading
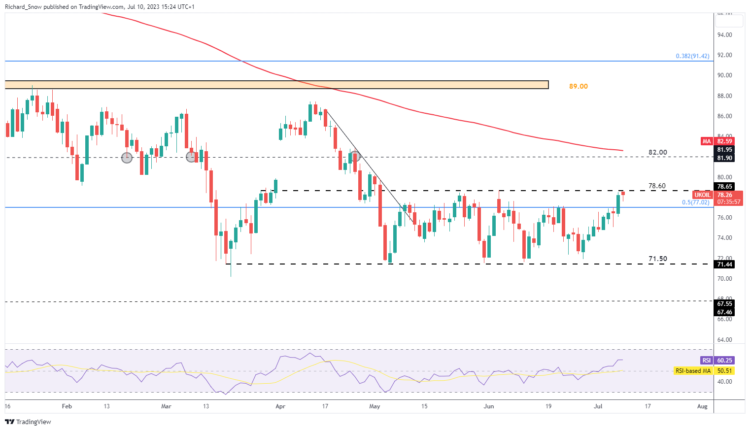
Brent crude oil entered a well-defined trading range/ channel of consolidation since May, completely containing price action ever since. The relatively narrow price range represents a very different oil market compared to the volatile prices around the Covid pandemic and the Russian invasion of Ukraine not long after.
After dropping just short of the level of support at $71.50, oil prices rallied to now test range support at $78.60. Having approached this level twice in the past, three times if you’re being generous, the threat of a bullish breakout remains in play. The more often a particular level is approached, the more likely it is that the market will eventually find enough momentum to overcome it.
Should we see a break and close above $78.60, a retest of this level – as support – appears prudent before assessing the likelihood of a further move towards $82. However, as things appear near the end of the London session, momentum has failed to materialize meaning price action continues within the range.
With prices remaining below the 200 simple moving average (SMA)
Brent Crude Oil Daily Chart
Source: TradingView, prepared by Richard Snow
Recommended by Richard Snow
Find out how to approach a ranging market
WTI Oil Prices Face Test at $73.90
WTI prices have followed a similar path to WTI but the technicals aren’t as clean. The announcement from OPEC about Saudi Arabia’s voluntary production cuts brought about a volatile daily candle which rose above the prior level of resistance ($73.90) only to drop well beneath it again. Since then, prices have traded within the broad range of $67 to $73.90.
With prices below the 200 SMA, the long-term downtrend suggests range traders may be eyeing a potential test and bounce lower for oil upon a lower close today.
WTI Oil Daily Chart

Source: TradingView, prepared by Richard Snow
— Written by Richard Snow for DailyFX.com
Contact and follow Richard on Twitter: @RichardSnowFX


Comments are closed.