Australian Dollar Slides After Disappointing Jobs Data. What’s Next for AUD/USD?
AUD/USD, Australian dollar – Outlook:
- AUD/USD’s broader trend remains up.
- Most recently, the relative economic growth underperformance has weighed on AUD/USD.
- What are the levels that could threaten AUD/USD’s broader uptrend?
Recommended by Manish Jaradi
How to Trade AUD/USD
AUD/USD TECHNICAL FORECAST – BULLISH
The recent retreat in the Australian dollar against the US dollar is a reflection of the divergence in the economic growth outlook of the two economies. This morning’s slide following dismal Australian jobs was no exception – employment fell for a second straight month in January while the jobless rate jumped to its highest level since May.
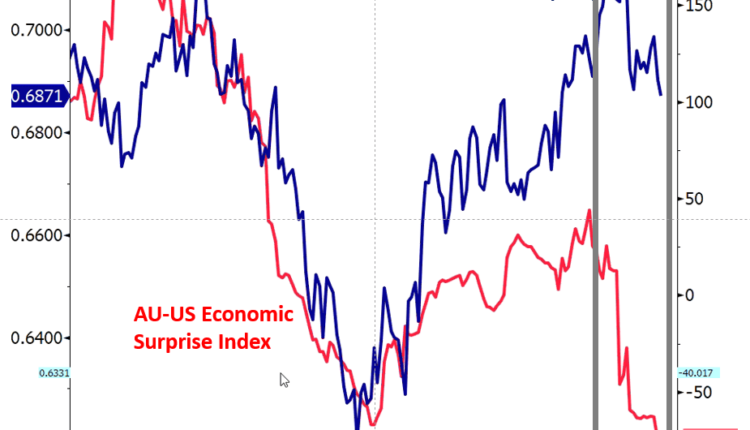
AUD/USD, down nearly 4% since the start of this month, has been guided by the relative underperformance of the Australian economy, as reflected in the Economic Surprise Indices (ESI). The Australian ESI is languishing around the 2020 lows, while its US counterpart is at the highest level in 10 months. The better-than-expected US data recently have translated into a marginal upgrade in consensus US economic growth expectations for 2023. In contrast, Australia's economic growth outlook for the current year is yet to see any upgrades.
AUD/USD Vs Australia Economic Surprise Index (ESI) Relative to US ESI
Source data: Bloomberg
Importantly, the subdued Australian economic data raise the question as to how long the RBA can continue to remain hawkish, while surprisingly strong US data recently mean that a Fed pause is still some way off. Moreover, the optimism over China’s reopening and rising commodity prices have supported AUD. However, it remains to be seen if the reopening translates into higher consumer spending (pent-up demand) via tourism spending or a pick-up in broad-based demand, including commodities, or both. In this regard, industrial commodity prices have softened since late January.
AUD/USD Daily Chart

Chart Created Using TradingView
On technical charts, AUD/USD is approaching crucial support on a horizontal line since mid-December at about 0.6900. A break below would confirm that the 4-month-long upward pressure had faded, exposing downside risks toward the December low of 0.6625, near the lower edge of the Ichimoku cloud. The broader uptrend is unlikely to reverse while AUD/USD holds above 0.6625.
AUD/USD Weekly Chart
Chart Created Using TradingView
The previous update highlighted the risk of a minor retreatafter AUD/USD ran into a major ceiling: the 200-week moving average, coinciding with the 89-week moving average and the August high of 0.7135. In line with the previous update, on the daily charts, AUD/USD remains bullish. However, the technical outlook could shift to Neutral if it decisively breaks below 0.6900.
Trade Smarter – Sign up for the DailyFX Newsletter
Receive timely and compelling market commentary from the DailyFX team
Subscribe to Newsletter
— Written by Manish Jaradi, Strategist for DailyFX.com


Comments are closed.