Australian Dollar recovers from recent losses after upbeat Private Sector Credit
- Australian Dollar recovers from the 10-month low after upbeat Aussie data.
- Australia’s monthly Private Sector Credit rose 0.4% compared to the expected 0.3%.
- US Dollar retreats after moderate economic data was released on Thursday.
The Australian Dollar (AUD) extends its gains on the second successive day on Friday. The AUD/USD pair recovers from recent losses, primarily supported by a correction in the US Dollar (USD) due to a pullback in US Treasury yields. Additionally, the Aussie pair gets minor support from the Australian upbeat Private Sector Credit (MoM) data.
Australia’s Bureau of Statistics (ABS) on Thursday revealed Retail Sales rose in August on a monthly basis below the market consensus. The soft consumer spending data in August might convince the Reserve Bank of Australia (RBA) to keep the interest rate unchanged next week.
However, Australia's monthly Consumer Price Index (CPI) improved from July's reading, which could be attributed to the increasing energy prices. The rise in inflation could increase the likelihood of another interest rate hike.
The US Dollar Index (DXY) snapped a winning streak after the moderate datasets from the United States (US). Gross Domestic Product (GDP) remained consistent as expected. Initial Jobless Claims for unemployment benefits printed a lower reading than the market consensus.
The US Dollar (USD) rallied during the week due to robust macros and reached its highest levels since December. Additionally, the USD’s strength is attributed to the positive performance of US Treasury yields. However, the yield on the 10-year US Treasury note has retreated from record highs.
Daily Digest Market Movers: Australian Dollar retraces recent losses due to a pullback in the US Dollar
- AUD/USD attempts to extend gains, trading around 0.6450 at the time of writing on Thursday.
- Australian Private Sector Credit (MoM) for August rose 0.4%, exceeding the market consensus to remain consistent at 0.3%. While the yearly readings rose 5.1%, slightly lower than the previous reading of 5.3%.
- The Aussie Dollar could further face challenges due to increased risk aversion sentiment in the market.
- Australian Retail Sales for August, fell to 0.2% from the previous rate of 0.5%. The index was expected to grow at a 0.3% rate.
- Australia’s Monthly Consumer Price Index (CPI) year-over-year for August rose 5.2% as expected, up from the previous rate of 4.9%.
- US GDP remained consistent at 2.1% as expected. Initial Jobless Claims for the week ending on September 22, printed a lower reading of 204K than the market consensus of 215K, which was 202K prior.
- US Pending Home Sales showed a decline of 7.1%, exceeding the market expectation of a 0.8% fall, swinging from the 0.9% rise previously.
- Chicago Fed President Austan Goolsbee expressed confidence that the Fed will bring inflation back to its target. Goolsbee also highlighted the rare opportunity to achieve this without a recession, indicating the US Federal Reserve’s (Fed) commitment to managing inflation while sustaining economic growth.
- Federal Reserve Bank of Richmond President Thomas Barkin acknowledged that recent inflation data has been positive but emphasized that it's premature to determine the future course of monetary policy. Barkin also noted that the data lost during a government shutdown could complicate the understanding of the economy.
- Traders await the US data such as the Core Personal Consumption Expenditure (PCE) Price Index, the Fed's preferred measure of consumer inflation, which is due on Friday. The annual rate is expected to reduce from 4.2% to 3.9%.
Technical Analysis: Australian Dollar trades above 0.6450, the barrier at 23.6% Fibo
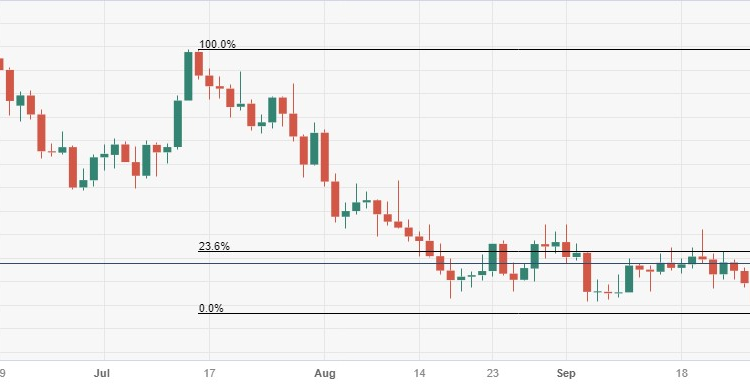
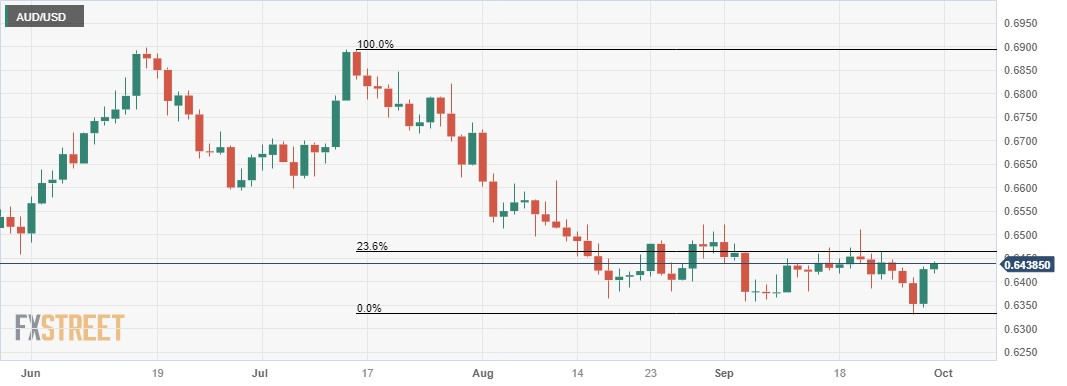
Australian Dollar trades higher around 0.6450 psychological level on Friday. A firm break above the latter could support the Aussie Dollar (AUD) to explore the region around 23.6% Fibonacci retracement at 0.6464, following the area around 0.6500 psychological level. On the downside, the fresh monthly low at 0.6331, followed by the 0.6300 psychological level could act as the key support.
AUD/USD: Daily Chart
Australian Dollar price today
The table below shows the percentage change of Australian Dollar (AUD) against listed major currencies today. Australian Dollar was the strongest against the Japanese Yen.
| USD | EUR | GBP | CAD | AUD | JPY | NZD | CHF | |
| USD | -0.17% | -0.16% | -0.12% | -0.53% | 0.03% | -0.62% | -0.09% | |
| EUR | 0.16% | 0.01% | 0.06% | -0.37% | 0.20% | -0.46% | 0.07% | |
| GBP | 0.16% | -0.02% | 0.05% | -0.36% | 0.19% | -0.46% | 0.06% | |
| CAD | 0.11% | -0.08% | -0.04% | -0.43% | 0.14% | -0.47% | 0.02% | |
| AUD | 0.53% | 0.35% | 0.36% | 0.42% | 0.56% | -0.10% | 0.43% | |
| JPY | -0.05% | -0.22% | -0.20% | -0.14% | -0.59% | -0.68% | -0.13% | |
| NZD | 0.62% | 0.45% | 0.46% | 0.52% | 0.10% | 0.65% | 0.53% | |
| CHF | 0.09% | -0.08% | -0.07% | -0.01% | -0.43% | 0.12% | -0.53% |
The heat map shows percentage changes of major currencies against each other. The base currency is picked from the left column, while the quote currency is picked from the top row. For example, if you pick the Euro from the left column and move along the horizontal line to the Japanese Yen, the percentage change displayed in the box will represent EUR (base)/JPY (quote).


Comments are closed.