Australian Dollar Fails to Firm on Strong Data as US Dollar Gains. Lower AUD/USD?
Australian Dollar, AUD/USD, US Dollar, Fed, ECB, EUR/USD, USD/JPY, Crude Oil – Talking Points
Recommended by Daniel McCarthy
How to Trade AUD/USD
The Australian Dollar tried to run higher on the back of solid retail sales figures, but the rally was short-lived.
Today’s retail sales came in at 0.7% month-on-month for May, notably above the 0.1% forecast and 0.0% previously. AUD/USD eclipsed 0.6620 before retreating.
The US Dollar also looked to reassert itself after yesterday’s comments from Fed Chair Jerome Powell that, “Although the policy is restrictive, it may not be restrictive enough and it has not been restrictive for long enough.”
The comments were made in Portugal yesterday and the ECB’s Christine Lagarde and the Bank of England’s Andrew Bailey share a similar hawkish stance. It is in contrast to the Bank of Japan’s Kazuo Ueda and he has said that he will maintain an ultra-loose policy setting.
In the aftermath of the Portugal gathering, USD/JPY is again nudging 7-months highs today above 144.50 while EUR/USD dipped back below 1.0900.
Crude is steady so far on Thursday after bouncing off recent lows. Data from the US Energy Information Agency (EIA) revealed that inventory had dropped by 9.603 million barrels in the week ended June 23rd. This was significantly larger than estimates of a 1.757 million barrels decrease.
Treasury yields have ticked up a basis point or 2 across the curve and gold continues to languish under US$ 1,920.
Most APAC equity indices have been fairly steady but Hong Kong’s Hang Seng Index (HSI) is deep in the red.
After Sweden’s Riksbank policy announcement, the US will see GDP data. EU leaders will be meeting in Brussels later today.
The full economic calendar can be viewed here.
Recommended by Daniel McCarthy
The Fundamentals of Range Trading
AUD/USD TECHNICAL ANALYSIS
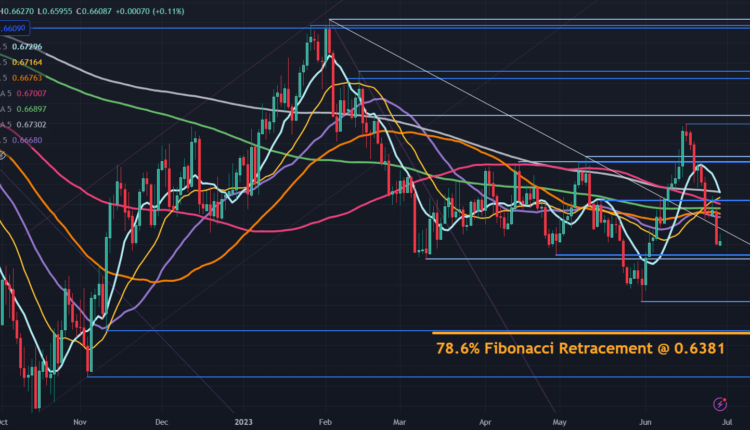
The case for more range trading for AUD/USD might lie in the clustering of all daily simple moving averages (SMA).
The 10-, 21- 34-, 55-, 100-, 200- and 260-day SMAs are all between 0.6668 and 0.6730.
Nearby resistance might be at the breakpoint of 0.6710 ahead of a potential resistance zone in the 0.6800 – 0.6820 area.
Further up, resistance could be at the previous peaks of 0.7011 and 0.7030 ahead of a cluster zone in the 0.0.7137 – 0.7157 area.
Support could be at the breakpoints of 0.6574 and 0.6565 or the late May low of 0.6458.
Further down, support may lie at the prior low of 0.6387 and the nearby Fibonacci level of 0.6381. The latter is the 78.6% Fibonacci Retracement of the move from the low of 0.6170 to the peak of 0.7158.
Chart created in TradingView
— Written by Daniel McCarthy, Strategist for DailyFX.com
Please contact Daniel via @DanMcCarthyFX on Twitter


Comments are closed.