Australian Dollar Drops on Mixed Jobs Data Ahead of CPI. Where to for AUD/USD?
Australian Dollar, AUD/USD, US Dollar, Unemployment, CPI, RBA, China – Talking Points
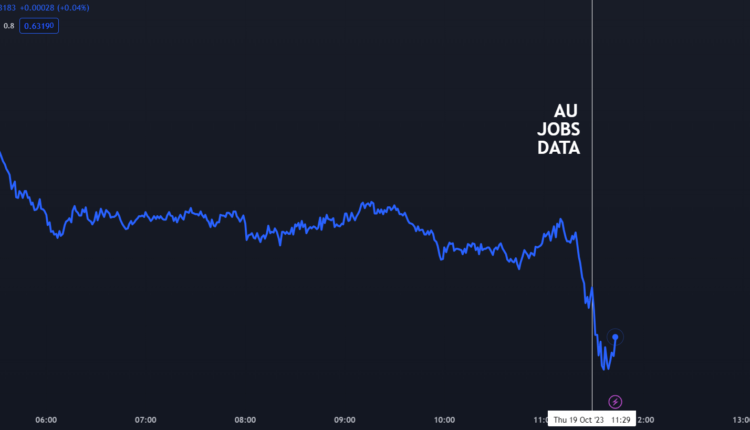
- The Australian Dollar crumbled after today’s jobs numbers
- The RBA meeting has taken on a new light with inflation in its sights
- The market is eyeing next week’s CPI. Will it drive AUD/USD direction?
Recommended by Daniel McCarthy
Get Your Free AUD Forecast
The Australian Dollar weakened today after a mixed reading from the latest employment report from the Australian Bureau of Statistics (ABS). It had already appeared vulnerable going into the figures.
The unemployment rate came in at 3.6% in September below the 3.7% anticipated and prior. 6.7k Australian jobs were added in the month, which was less than the 20k expected to be added and 64.9k previously.
Unfortunately, 39.9k full time jobs were lost while 46.5k part time roles were added and the participation rate fell from 67.0% to 66.7%, assisting the headline unemployment rate to inch lower.
The RBA left rates unchanged earlier this month at 4.10% but there have been some notable developments since then.
It started with Reserve Bank of Australia (RBA) Assistant Governor Chris Kent on Wednesday last week.
While he highlighted the problems around the time lags in the transmission effect of monetary policy, he went on to say, “Some further tightening may be required to ensure that inflation, that is still too high, returns to target.”
Then earlier this week, the RBA meeting minutes were released, and they showed that the board was far closer to hiking than the statement on monetary policy said at the time.
Specifically, the minutes stated, “The Board has a low tolerance for a slower return of inflation to target than currently expected. Whether or not a further increase in interest rates is required would, therefore, depend on the incoming data and how these alter the economic outlook and the evolving assessment of risks.”
Compounding the hawkish tilt, RBA Governor Michele Bullock spoke at a summit yesterday and pointed to the problems of external events triggering inflation when they arrive one after the other.
She said, “the problem is we’ve had shock after shock after shock. The more that keeps inflation elevated, even if it’s from supply shocks, the more people adjust their thinking.”
Before adding, “And the more people adjust their inflation expectations, the more entrenched inflation is likely to become. So that’s the challenge.”
All of this brings next Wednesday’s Australian CPI data for the third quarter into sharp focus for the Aussie Dollar.
A Bloomberg survey of economists is anticipating headline inflation to be 5.2% year-on-year against 6.0% previously, well above the RBA’s mandated target of 2 – 3%.
A wide variation from expectations could trigger a bout of volatility for AUD/USD.
In the near term, Treasury yields have been climbing higher, underpinning the US Dollar and this may see AUD/USD test lower levels if yields continue higher.
Recommended by Daniel McCarthy
Get Your Free Top Trading Opportunities Forecast
AUD/USD PRICE REACTION TO JOBS DATA
Chart created in TradingView
AUD/USD TECHNICAL ANALYSIS UPDATE
AUD/USD bounced off the low of 0.6286 to start the week and if the price fails to move below that level, a Double Bottom might be in place.
Overall, it remains in a descending trend channel and bearish momentum might be intact for now.
A bearish triple moving average (TMA) formation requires the price to be below the short-term Simple Moving Average (SMA), the latter to be below the medium-term SMA and the medium-term SMA to be below the long-term SMA. All SMAs also need to have a negative gradient.
When looking at any combination of the 21-, 34-, 55- 100- and 200-day SMAs, the criteria for a bearish TMA have been met and might suggest that bearish momentum is evolving.
To learn more about trend trading, click on the banner below.
Last Wednesday’s high of 0.6445 coincided with the 55-day Simple Moving Average (SMA) and that level may offer resistance ahead of a cluster of prior peaks in the 0.6500 – 0.6510 area.
Further up, the 0.6600 – 0.6620 area might be another resistance zone with several breakpoints and previous highs there.
On the downside, support may lie near the previous lows of 0.6286, 0.6272 and 0.6170.
The latter might also be supported at 161.8% Fibonacci Extension level at 0.6186.
AUD/USD DAILY CHART

Chart created in TradingView
— Written by Daniel McCarthy, Strategist for DailyFX.com
Please contact Daniel via @DanMcCathyFX on Twitter


Comments are closed.