

Australian Dollar, AUD/USD, US Dollar, Bollinger Bands, Momentum – Talking Points
- The Australian Dollar has taken a breather after making a new high
- AUD/USD eclipsed 70 cents but looks to be at a crossroads for now
- If the trend is to continue, will momentum push AUD/USD higher still?
Recommended by Daniel McCarthy
Get Your Free AUD Forecast
The Australian Dollar made a five-month high at 0.7019 to start this week as it remains within an ascending trend channel.
The stretch higher saw the price move above the upper band of the 21-day simple moving average (SMA) based Bollinger Band.
Since it closed back inside the band the price has moved mostly sideways. The move back inside the band might signal a pause in the bullish run or a potential reversal.
Resistance could be at previous highs and breakpoints of 0.7019, 0.7047, 0.7069 and 0.7137.
On the downside, support could be at the prior lows and breakpoints of 0.6930, 0.6916 and 0.6860.
AUD/USD BOLLINGER BANDS CHART
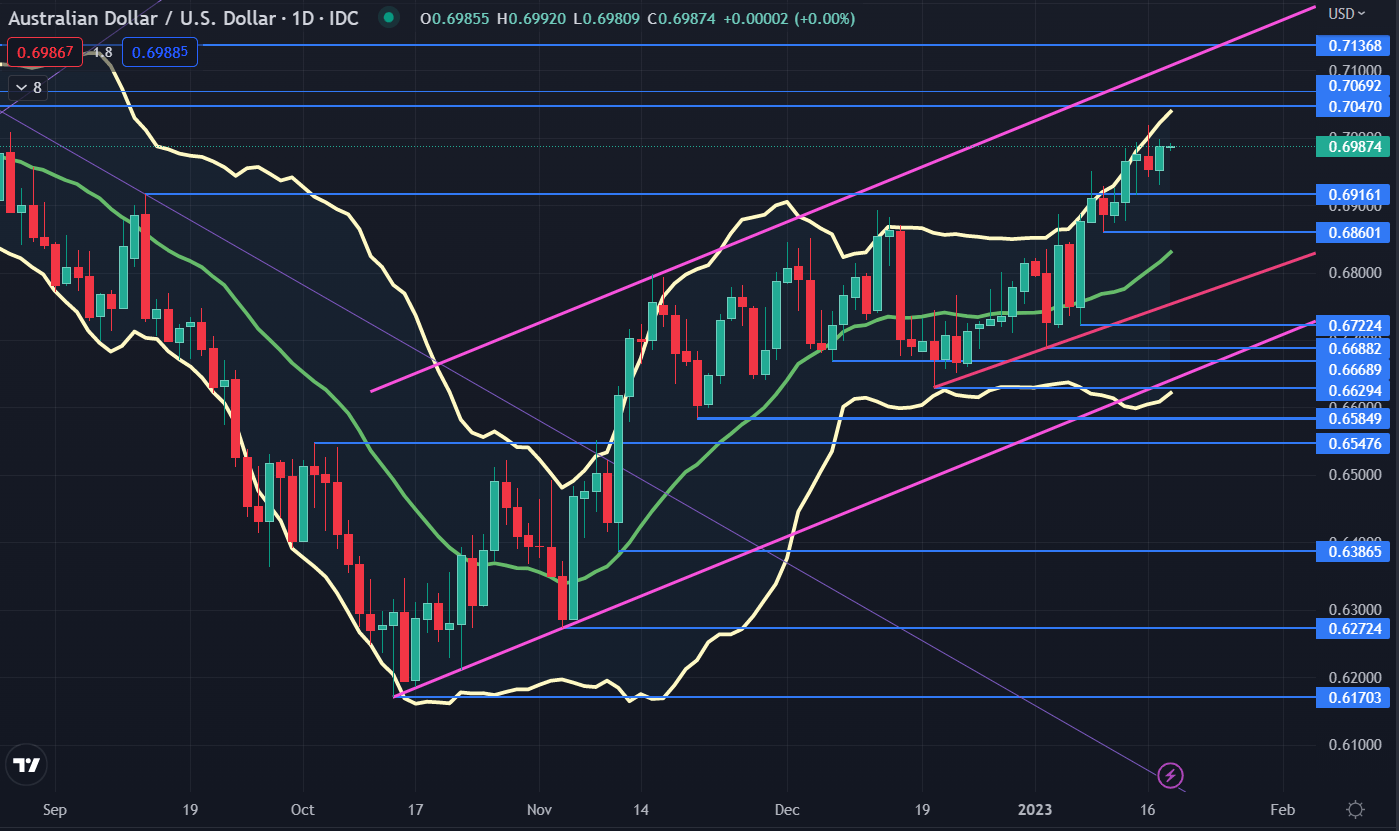
Chart created in TradingView
Looking at the set-up of the simple moving average (SMA) across a series of time frames reveals the potential for short and medium-term bullish momentum to evolve. Longer-term momentum signals are yet to confirm this.
This is illustrated in the chart below by the price being above all period SMAs and the gradients of the 10, 21-, 55- and 100-day SMAs being positive. Although the price is above the 200- and 260-day SMAs, their gradients are negative.
A bullish triple moving average (TMA) formation requires the price to be above the short-term SMA, the latter to be above the medium-term SMA and the medium-term SMA to be above the long-term SMA. All SMAs also need to have a positive gradient. A continuation of the ascending trend could see a TMA unfold.
Recommended by Daniel McCarthy
How to Trade AUD/USD
The 21-day SMA crossed above the 200-day SMA today to form a Golden Cross. This may be supportive of short-term bullish momentum potentially converting into longer-term momentum,
If the price continues to hold these levels or appreciates, the 10-day SMA might cross the 260-day SMA to form another Golden Cross.
The 100-day SMA currently dissects with the lower bound of the ascending channel and the low seen at 0.6629. A break below these technical levels could indicate the end of the bullish trend and momentum.
AUD/USD MOVING AVERAGES CHART
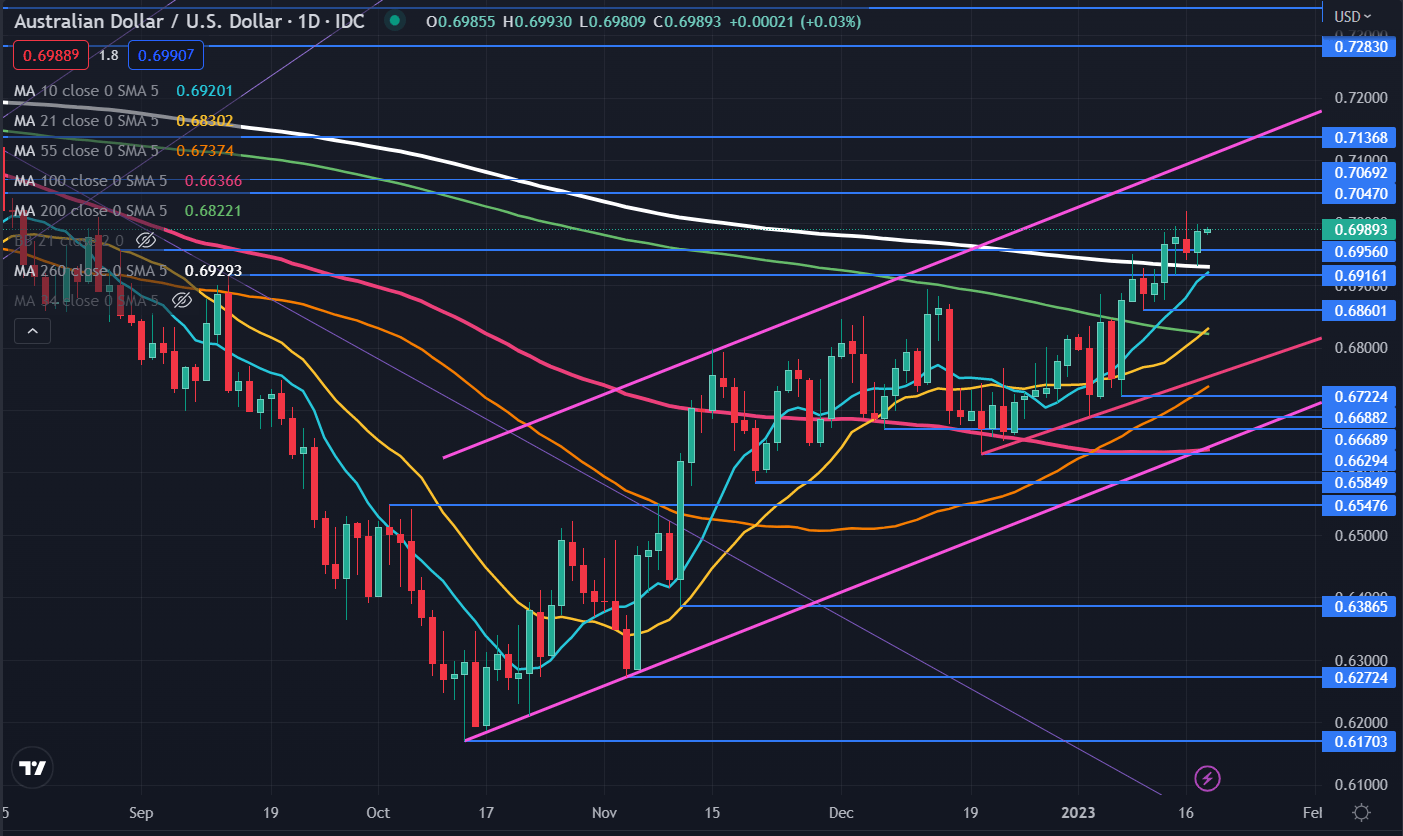
Chart created in TradingView
— Written by Daniel McCarthy, Strategist for DailyFX.com
To contact Daniel, use the comments section below or @DanMcCathyFX on Twitter
Comments are closed.