AUD/USD Stuck in No Man’s Land, USD/JPY Blasts Off as Bears Taken to Woodshed
AUD/USD TECHNICAL ANALYSIS
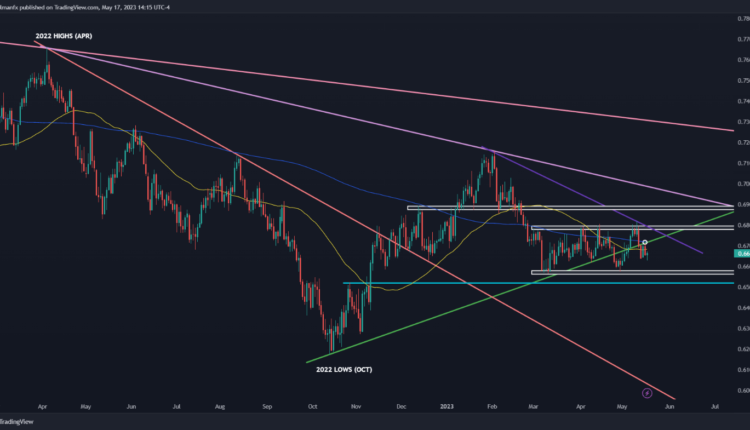
AUD/USD (Australian dollar – US dollar) has been trading largely sideways since early March, moving predictably within the confines of a lateral channel, and bouncing back and forth between its upper and lower boundaries, two regions that represent technical resistance and support respectively.
This horizontal corridor, with its peak a touch below the psychological 0.6800 mark and its base near 0.6575, can be seen as no man’s land from a technical standpoint, meaning that neither buyers nor sellers have decisive control of the market in the absence of conviction.
During periods of consolidation and limited volatility, range trading setups can be effective and easy to execute for the most part. These strategies consist of first identifying the interval in which the asset in question has traded recently.
After taking note of the relevant band, the idea is to go long at the bottom threshold (support) ahead of a possible rebound based on recent historical patterns; or to go short around the uppermost point of the range (resistance) in anticipation of a pullback.
Looking at AUD/USD, prices are currently sitting below a key ceiling at 0.6720, where the 200-day simple moving average aligns with a medium-term ascending trendline. If this area is breached, the pair may be on its way toward 0.6800, opening the door to entertain range trading strategies.
On the flip side, if Aussie heads lower, we may see a move towards 0.6575 in short order. This could create another opportunity to analyze potential lateral market configurations.
| Change in | Longs | Shorts | OI |
| Daily | 5% | 1% | 4% |
| Weekly | 44% | -30% | 10% |
AUD/USD TECHNICAL CHART
AUD/USD Chart Prepared Using TradingView
| Change in | Longs | Shorts | OI |
| Daily | -11% | 15% | 5% |
| Weekly | -27% | 38% | 9% |
USD/JPY TECHNICAL ANALYSIS
USD/JPY staged a solid rally today, breaching two key technical ceilings: the first located near 136.60 (38.2% Fibonacci retracement of the October 2022/January 2023 decline), and the second at 137.05 (the 200-day simple moving average).
Wednesday’s bullish events have reinforced the upward momentum, allowing the pair to come within striking distance of recapturing its 2023 peak just a tad below the psychological 138.00 handle – the next major resistance in play.
With market sentiment favoring the upside at the moment, bulls may be on the cusp of driving the exchange rate well past the 138.00 mark and setting fresh yearly highs in the process, a scenario which could boost positive impetus, triggering a potential surge towards 140.00 over the near term.
In the event of a setback and bearish reversal, initial support rests at 136.60. On further weakness, we could witness a potential pullback toward 135.25.
USD/JPY TECHNICAL CHART

USD/JPY Technical Chart Created Using TradingView


Comments are closed.