AUD/USD: Developing downward momentum – Analytics & Forecasts – 14 August 2023
Australian central bank leaders believe that higher interest rates and rising costs of living will continue to put unprecedented pressure on households and, as a result, on consumption, while per capita output will decline in the second half of the year.
Whether there will be more rate hikes this year will depend on data coming out of Australia, especially on wage growth and inflation.
However, many economists believe that the RBA leaders are very close to the peak of interest rates, and the August decision on the interest rate is a clear signal that the RBA is taking a wait-and-see attitude, especially since the bank itself expects a further decline in inflation towards the target level of 2% – 3%.
At the end of the month (August 30), fresh data on consumer inflation in Australia will be presented, and if they also confirm its slowdown, then at the next September meeting, the RBA will most likely again take a pause in raising interest rates. At the same time, economists believe that if the interest rate is raised at this meeting (September 5), then this will be its last increase in the current cycle of tightening the monetary policy of the RBA. Most likely, this will be a bearish factor for the Australian dollar.
However, further tightening of monetary policy can also become a negative factor for it, economists say: if inflation starts to grow again, then with a further increase in interest rates, pressure on the labor market and the Australian economy will increase.
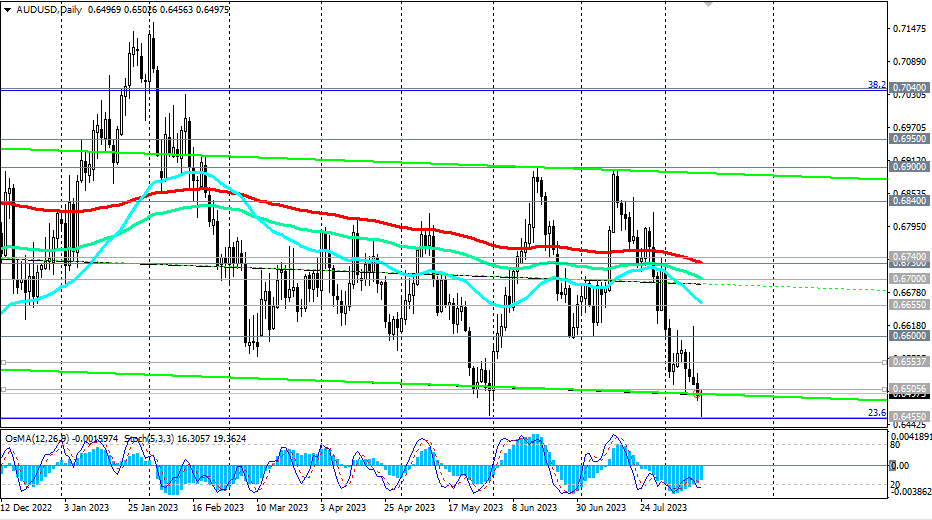
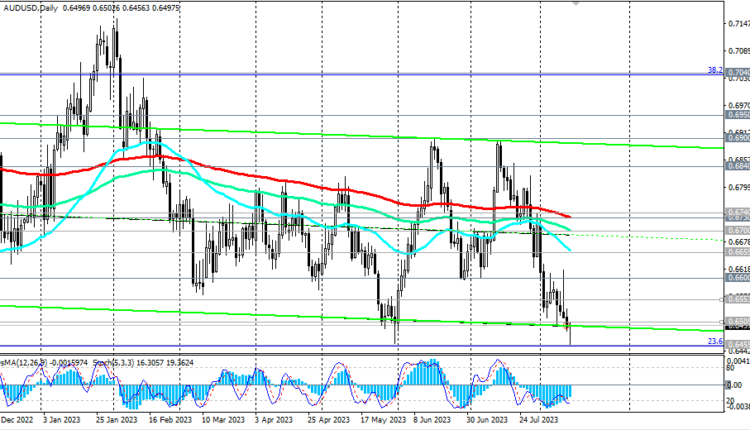
From a technical point of view, AUD/USD is developing a downward trend, also being under pressure from the US dollar after the publication of statistics from the US.
AUD/USD continues to trade in the bear market zone, short-term, medium-term, long-term – below the key resistance level 0.7040. In the previous review, we suggested that in the event of a breakdown of the support level 0.6755, it would be logical to expect a further decline in the pair as part of a long-term bearish trend. So far, events are developing exactly according to this main scenario.
Support levels: 0.6455, 0.6390, 0.6285, 0.6200, 0.6170
Resistance levels: 0.6505, 0.6553, 0.6600, 0.6655, 0.6700, 0.6730, 0.6740, 0.6800, 0.6840, 0.6900, 0.6950, 0.7000, 0.7040

*) see also


Comments are closed.