ASX 200 and KOSPI Technical Outlook: Kospi to Catch Up?
ASX, ASX 200 INDEX, KOSPI, KOSPI COMPOSITE INDEX – TECHNICAL OUTLOOK:
- A minor pause in the ASX 200 index can’t be ruled out.
- KOSPI index could be gearing up for some strength.
- What are the key levels to watch?
Recommended by Manish Jaradi
Traits of Successful Traders
ASX 200 SHORT-TERM TECHNICAL OUTLOOK – BULLISH
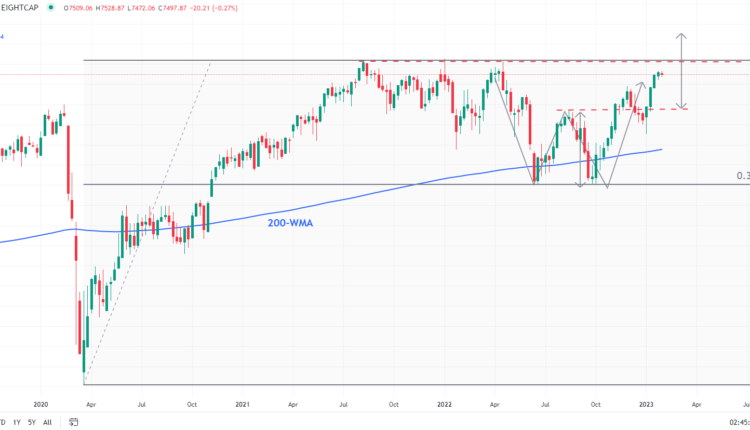
Australia ASX 200 index’s break above another barrier at the December high of 7375 reasserts the uptrend. This follows the barrier at the August high of 7138 and a hold last year above crucial support on the 200-week moving average. The break above 7138 triggered a double bottom (the June 2022 and the October 2022 lows), pointing to a potential rise toward 7865.
ASX 200 INDEX Weekly Chart
Chart Created Using TradingView
The index has been resilient in the face of tightening of global financial conditions in recent months, approaching its record high compared to some of its peers that have yet to recoup a large part of last year’s losses. Furthermore, the price objective of the bullish double bottom pattern implies a break above the record high of 7633 hits in 2021 to new cycle highs.
ASX 200 INDEX Daily Chart

Chart Created Using TradingView
In the near term, however, the ASX 200 index is looking overbought as it tests a stiff barrier on a rising trendline from a year ago (see the daily chart). The previous two retreats in the index from the resistance were associated with similar levels of the 14-day Relative Strength Index (RSI). Immediate support is at the December high of 7375. Any break below would indicate that the short-term upward pressure had faded, pointing to a range developing. However, the medium-term uptrend is unlikely to be at risk while the index holds above the 200-day moving average (now at about 7000).
KOSPI SHORT-TERM TECHNICAL OUTLOOK – NEUTRAL
After months of sideways price action, the Kospi index appears to be finally gaining some upward momentum.
While the South Korean benchmark index hasn’t broken any significant resistance, the recent price action appears to resemble a reverse head & shoulders pattern (the left shoulder is the mid-2022 low, the head is the September low, and the right shoulder is the early-January low). This explains the Neutral outlook for now.
KOSPI COMPOSITE INDEX Daily Chart
Chart Created Using TradingView
However, any break above the neckline, a marginally downward-sloping trendline from August (at about 2500) would turn the outlook to Bullish, paving the way toward 2870. Such a break would also coincide with a break above a major hurdle on the 200-day moving average for the first time since 2021. Importantly, the bullish would confirm that the downward pressure had faded and open the door for a corrective rally, in line with some of its regional peers. For this potential bullish view to remain intact, Kospi needs to hold above vital support at the early-January low of 2181.
Recommended by Manish Jaradi
The Fundamentals of Breakout Trading
— Written by Manish Jaradi, Strategist for DailyFX.com


Comments are closed.