Arrows Curves and Clouds Forex Trading Strategy
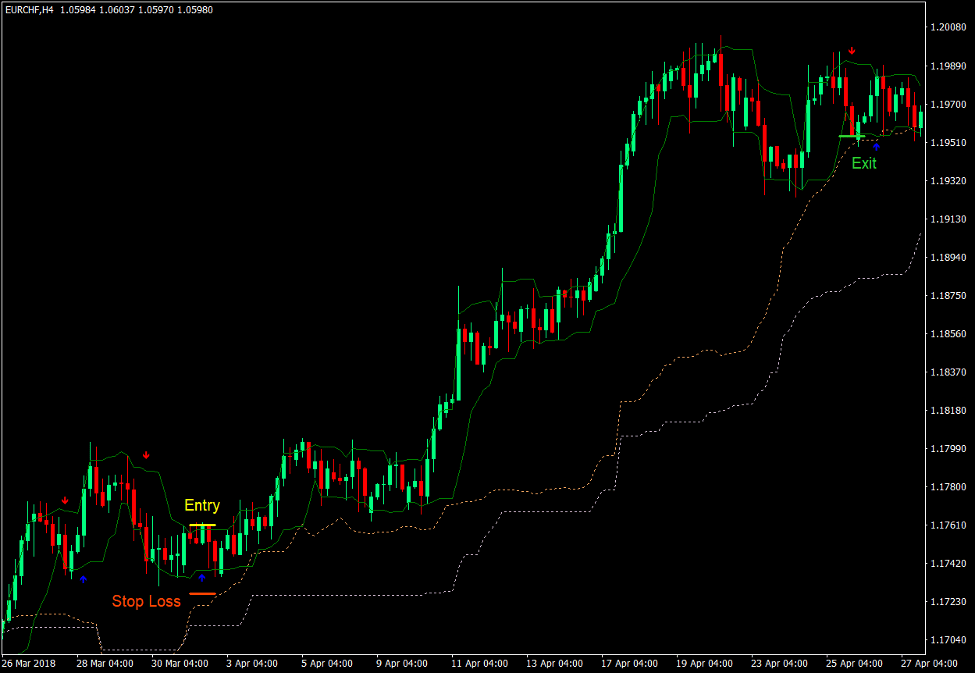
Trends are a vital consideration that traders have to look out for when trading the forex market. This is because trends have a strong influence with regards to the direction that the market is most likely to flow to. Imagine the forex market as a river which has an underlying current. Rivers typically flow downstream as the forex markets would usually flow in the direction of the trend. Traders who make the mistake of trading against the trend is like a swimmer going upstream. The counter-trend trade would sooner or later loose its energy and revert back to the direction of the trend causing counter-trend traders to incur some losses.
Trend following traders on the other hand have the advantage of trading with the flow of the market. This makes price more likely to move in the direction of the trend rather than against it.
One of the best practices that traders can do to ensure a high probability trade setup that is in line with the direction of the trend is to observe the trend in different horizons. Traders should consider the short-term trend, mid-term trend and the long-term trend. Trades that are in line with the direction of the trend on different horizons tend to have a higher win probability.
In this strategy we will be looking at how a couple of indicators may be used to trade whenever both the long-term and the short-term trends are in confluence.
Ichimoku Kinko Hyo – Kumo
The Ichimoku Kinko Hyo indicator is one of the few technical indicators that can claim to be a complete trading system on its own. This is because the Ichimoku Kinko Hyo indicator is composed of multiple lines which act like a moving average line. These lines are mostly a median of price action within differing periods and are moved behind or ahead of the current period.
The Ichimoku Kinko Hyo indicator is composed of the Tenkan-sen, Kijun-sen, Senkou Span A, Senkou Span B and the Chikou Span lines. These lines represent varying trend horizons, from the short-term trend to the long-term trend.
The Senkou Span A and B lines form the Kumo or Cloud, which represents the long-term trend. Senkou Span A, or leading Span A, is the median of the Tenkan-sen and Kijun-sen lines forwarded 26 periods ahead. The Senkou Span B line on the other hand is the median of price action within the past 52 periods forwarded 26 periods ahead.
The long-term trend can be identified based on how the Senkou Span A and B lines are stacked. The trend is bullish if the Senkou Span A line is above the Senkou Span B line, and bearish if the Senkou Span A line is below the Senkou Span B line. As such, crossovers between the two lines can be considered as an indication of a long-term trend reversal.
Lukas 1 Arrows and Curves
Lukas 1 Arrows and Curves is a momentum following technical indicator which is both a channel type of indicator and a signal indicator.
This indicator plots two lines which envelope price action. One line is plotted above price action and another below price action. These lines are based on recent extreme price movements. This creates a channel-like structure which envelopes price action.
The indicator then identifies momentum based on a candle stick closing strongly outside of the lines. The indicator identifies these momentum reversals whenever the direction of the breakout is against the last momentum it identified. It then plots an arrow on the candle where it identified a momentum reversal.
This indicator can be used as a momentum reversal signal indicator based on the arrows plotted. Traders can use these arrows as an entry trigger for their momentum-based trade setups.
Trading Strategy
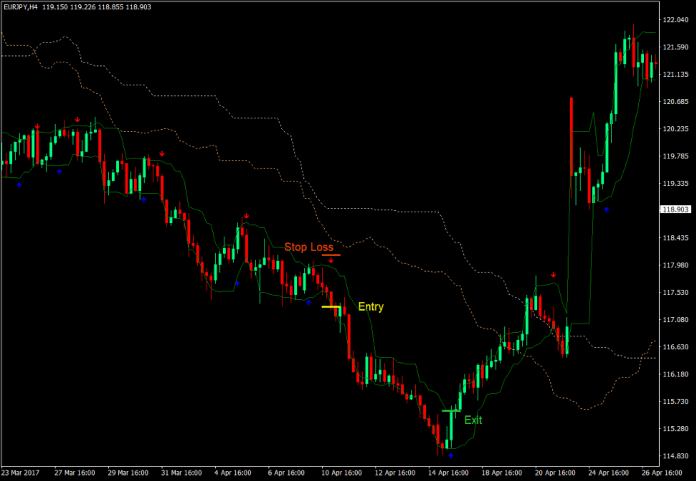
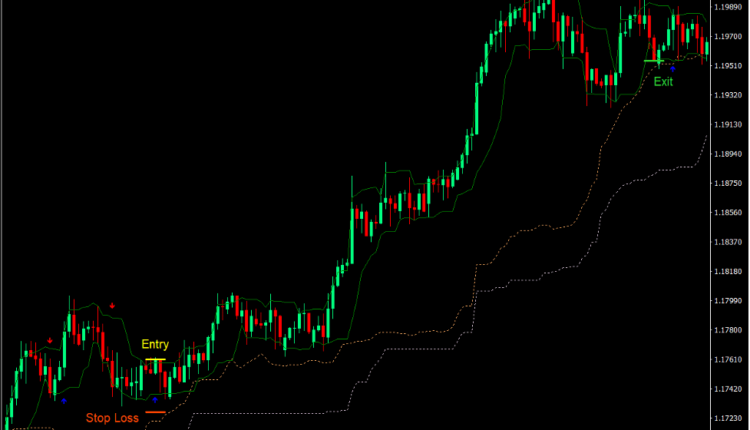
This trading strategy is a momentum-based trading strategy which is aligned with the long-term trend using the confluence of trend and momentum signals coming from the Kumo of the Ichimoku Kinko Hyo indicator and the Lukas 1 Arrows and Curves indicator.
The Kumo is used to identify the direction of the long-term trend. This is indicated by how the Senkou Span A (dotted brown line) and the Senkou Span B (dotted thistle line) are stacked.
The trend is then confirmed based on the location of price action and the Lukas 1 Arrows and Curves channel is in relation to the Kumo. It is also further confirmed by price action based on the pattern of the price swings it creates.
Once the trend direction is confirmed, we could then wait for the Lukas 1 Arrows and Curves indicator to give us a momentum entry signal. The entry signal is an arrow plotted pointing the direction of the long-term trend.
Indicators:
- Ichimoku
- Lukas1_Arrows_Curves
Preferred Time Frames: 1-hour, 4-hour and daily charts
Currency Pairs: FX majors, minors and crosses
Trading Sessions: Tokyo, London and New York sessions
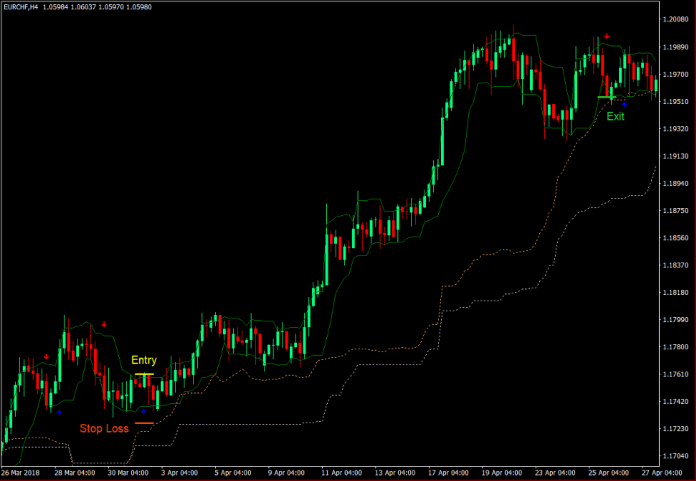
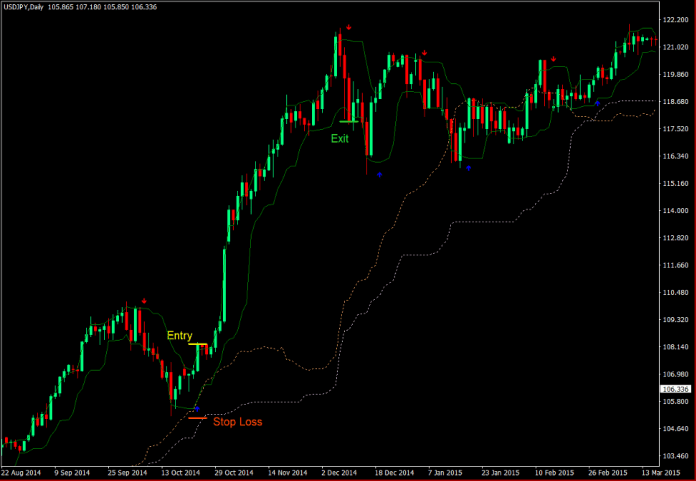
Buy Trade Setup
Entry
- The Senkou Span A line should be above the Senkou Span B line.
- Price action and the Lukas 1 Arrows and Curves channel should be above the Kumo.
- Price action should plot a rising swing point pattern.
- Enter a buy order as soon as the Lukas 1 Arrows and Curves indicator plots an arrow pointing up.
Stop Loss
- Set the stop loss at a support below the entry candle.
Exit
- Close the trade as soon as the Lukas 1 Arrows and Curves indicator plots an arrow pointing down.
Sell Trade Setup
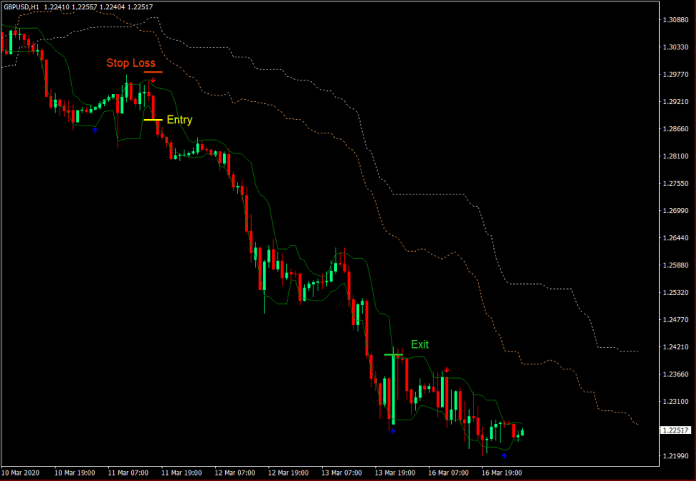
Entry
- The Senkou Span A line should be below the Senkou Span B line.
- Price action and the Lukas 1 Arrows and Curves channel should be below the Kumo.
- Price action should plot a dropping swing point pattern.
- Enter a sell order as soon as the Lukas 1 Arrows and Curves indicator plots an arrow pointing down.
Stop Loss
- Set the stop loss at a resistance above the entry candle.
Exit
- Close the trade as soon as the Lukas 1 Arrows and Curves indicator plots an arrow pointing up.
Conclusion
This trading strategy shows us how aligning the short-term momentum or trend with the long-term trend can provide us with a high probability trade setup. On top of the high win probability, this strategy also has the capacity to produce trades with high yields.
This strategy can be used as a trend reversal strategy on the long-term trend near the start of the Kumo reversal or as a trend continuation strategy as the Lukas 1 Arrows and Curves indicator plots arrows confirming the direction of the trend right after some minor retracements.
Either way, traders can make use of this type of strategy to earn some profits from the forex market.
Forex Trading Strategies Installation Instructions
Arrows Curves and Clouds Forex Trading Strategy is a combination of Metatrader 4 (MT4) indicator(s) and template.
The essence of this forex strategy is to transform the accumulated history data and trading signals.
Arrows Curves and Clouds Forex Trading Strategy provides an opportunity to detect various peculiarities and patterns in price dynamics which are invisible to the naked eye.
Based on this information, traders can assume further price movement and adjust this strategy accordingly.
Recommended Forex MetaTrader 4 Trading Platform
- Free $50 To Start Trading Instantly! (Withdrawable Profit)
- Deposit Bonus up to $5,000
- Unlimited Loyalty Program
- Award Winning Forex Broker
- Additional Exclusive Bonuses Throughout The Year

>> Claim Your $50 Bonus Here <<
Click Here for Step-By-Step XM Broker Account Opening Guide
How to install Arrows Curves and Clouds Forex Trading Strategy?
- Download Arrows Curves and Clouds Forex Trading Strategy.zip
- *Copy mq4 and ex4 files to your Metatrader Directory / experts / indicators /
- Copy tpl file (Template) to your Metatrader Directory / templates /
- Start or restart your Metatrader Client
- Select Chart and Timeframe where you want to test your forex strategy
- Right click on your trading chart and hover on “Template”
- Move right to select Arrows Curves and Clouds Forex Trading Strategy
- You will see Arrows Curves and Clouds Forex Trading Strategy is available on your Chart
*Note: Not all forex strategies come with mq4/ex4 files. Some templates are already integrated with the MT4 Indicators from the MetaTrader Platform.
Click here below to download:
Get Download Access

Comments are closed.