Finds acceptance above 200-EMA as USD Index incurs losses
- NZD/USD has extended its revival move above 0.6230 as USD Index has extended losses.
- The US Dollar has failed to capitalize on hawkish commentary from Fed Bostic.
- The Kiwi asset has scaled above the mighty 200-period EMA, indicating that the broader trend is bullish now.
The NZD/USD pair has stretched its recovery above 0.6230 in the Asian session. A revival in the Kiwi asset is backed by a further correction in the US Dollar Index (DXY). The USD Index has extended its losses after surrendering the critical support of 105.00. The USD Index has dropped to near 104.80 and is expected to remain on the tenterhooks ahead of the release of the United States ISM Services PMI data.
S&P500 futures are showing marginal losses in the Asian session after a solid recovery on Thursday, portraying a minor caution amid overall bullish market sentiment. The return provided on 10-year US Treasury bonds is hovering above 4.06%.
The USD Index is struggling to stabilize its feet despite hawkish commentaries from Federal Reserve (Fed) policymakers. Atlanta Fed Bank President Raphael Bostic has favored a 25 basis points rate hike in March but has left room opened for a more hawkish rate outlook if inflation and labor market data come in stronger.
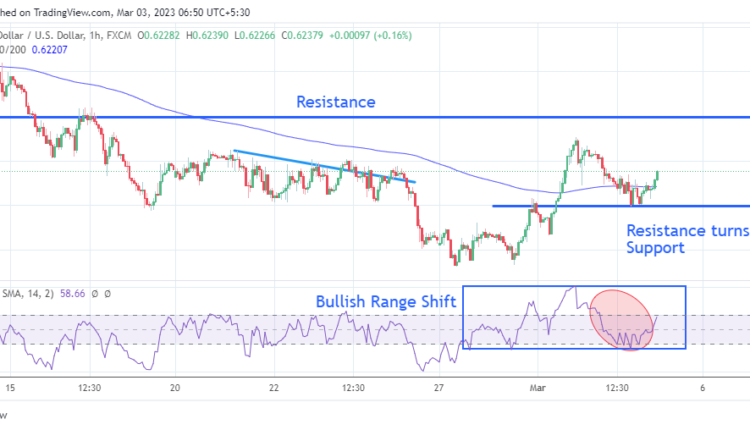
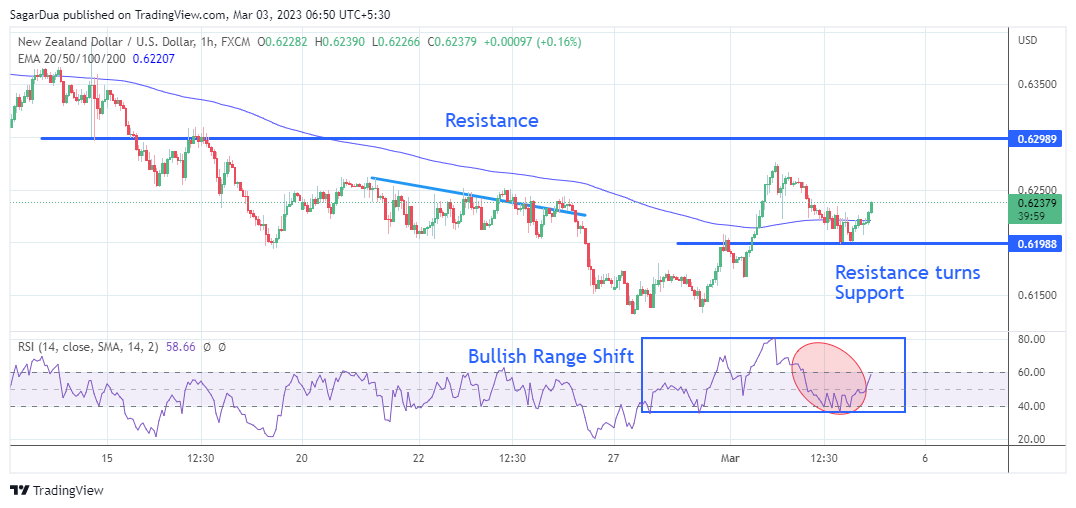
NZD/USD has witnessed stellar buying interest after dropping to near the horizontal support plotted from March 2 low at 0.6200, which was earlier a resistance for the New Zealand Dollar. The Kiwi asset has scaled above the mighty 200-period Exponential Moving Average (EMA) at 0.6220, indicating that the broader trend is bullish now.
A scrutiny of the Relative Strength Index (RSI) (14) indicates that the momentum oscillator has already delivered a bullish reversal. The oscillation range of the RSI (14) has already shifted to 40.00-80.00. Therefore, the momentum indicator has found a cushion at 40.00.
A buying opportunity in the Kiwi asset will emerge it will surpass March 1 high at 0.6276, which will drive the pair toward the round-level resistance at 0.6300 followed by February 14 high at 0.6389.
In an alternate scenario, a breakdown of January 6 low at 0.6193 will drag the asset toward November 28 low at 0.6155. A slippage below the latter will expose the asset for more downside toward the round-level support at 0.6100.
NZD/USD hourly chart


Comments are closed.