Forex Watchlist: Simple Pullback Play on EUR/JPY
Here’s one for the euro bulls!
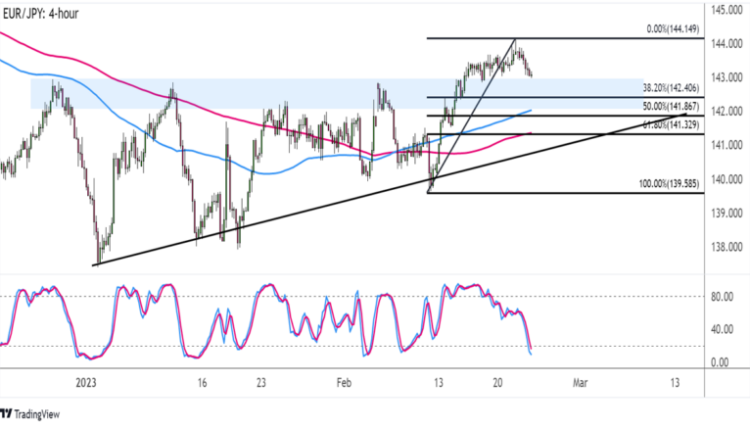
EUR/JPY busted through a ceiling recently and seems to be in the middle of a pullback.
Which support levels might hold?

EUR/JPY 4-hour Forex Chart by TradingView
Thanks to mostly upbeat eurozone data lately, this pair has managed to break above the resistance zone around 142.50 to 143.00.
Bulls appear to be having some difficulty charging past the 144.15 area, though, so a quick correction to the former resistance area might be needed.
The handy-dandy Fib tool shows where more buyers might be waiting to hop in. In particular, the 38.2% Fib is looking like a good spot to enter, as it coincides with the area of interest.
A larger correction could reach the 50% level near the 142.00 handle, which lines up with the 100 SMA dynamic inflection point. An even deeper pullback could dip to the 61.8% Fib near the 200 SMA and a rising trend line.
If any of these support levels are able to keep losses at bay, EUR/JPY could resume the climb to the swing high and beyond!
Technical indicators are suggesting that the odds are in favor of more gains. The 100 SMA is above the 200 SMA to confirm the presence of upside momentum while Stochastic is inching closer to the oversold region.
Just make sure you watch out for the next event risk for yen pairs, which might be the upcoming speech by BOJ Governor-Designate Ueda on Friday’s Asian session.
Some say that he could give off hawkish vibes by suggesting an end to the central bank’s yield curve control scheme, but others predict that he would express support for the ongoing easing moves.
In any case, make sure you adjust your risk in anticipation of additional volatility then!
This content is strictly for informational purposes only and does not constitute as investment advice. Trading any financial market involves risk. Please read our Risk Disclosure to make sure you understand the risks involved.


Comments are closed.