Gold Prices Looked Past an Inflation Beat, But Broader Outlook Remains Bearish
Gold, XAU/USD, US Inflation, Fespeak, Technical Analysis – Briefing:
- Gold prices finished flat despite higher US CPI surprise
- Markets were also influenced by Fedspeak on Tuesday
- Down the road, XAU/USD’s outlook may remain bearish
Recommended by Daniel Dubrovsky
Get Your Free Gold Forecast
Gold prices finished the past 24 hours relatively flat as critical competing headlines fought for the attention of the yellow metal. First, all eyes were on January’s US CPI report. Headline inflation clocked in at 6.4% y/y against the 6.2% estimate. This was also higher than a prediction I made using a lag analysis model. Still, it was within the error region. More importantly, the model sees February CPI at 6.3% y/y.
Combined with a stronger-than-anticipated core reading, this is not terribly great news for the Federal Reserve, which is trying to bring inflation down to a medium-term average target of about 2%. Financial conditions have been easing since the end of last year as markets priced in the conclusion of the tightening cycle and then some (in the form of anticipated rate cuts towards the end of this year).
Including today’s CPI report, markets have added about 3 rate hikes to the 2-year outlook since the day before January’s non-farm payrolls report blowout. As a result, the 2-year Treasury yield has rallied almost back to highs from November. This is as the US Dollar found some support. Unsurprisingly, this combination has not been working out great for gold.
Despite the unexpectedly sticky CPI report, gold prices were relatively mute. That is likely due to Fedspeak. Philadelphia Fed President Patrick Harker noted on Tuesday that the central bank was zeroing in on where rates could be restrictive enough – a sign that peak rates might be soon around the corner. But, he also added that the Fed might have to do more.
Put together, this likely points to a Fed that might keep rates restrictive for longer. Despite what occurred with gold over the past 24 hours, down the road, this may continue spelling more trouble for the anti-fiat yellow metal. Later today, the US will release January retail sales. Solid outcomes could risk adding further downside pressure to XAU/USD.
Gold Technical Analysis
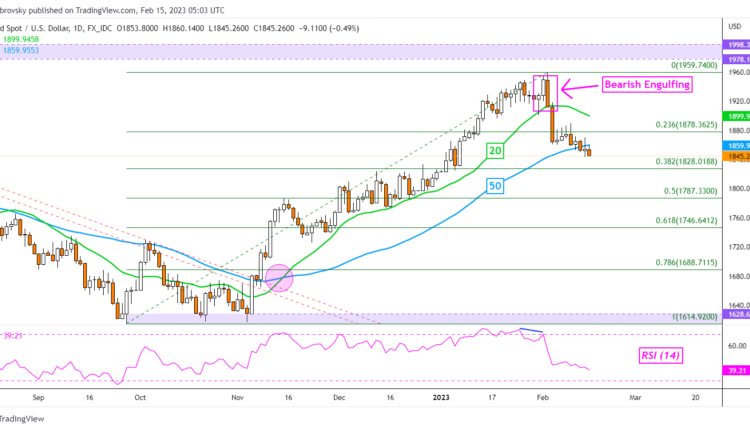
On the daily chart, gold is trying to extend losses under the 50-day Simple Moving Average (SMA). That is offering an increasingly bearish perspective, placing the focus on the 38.2% Fibonacci retracement level at 1828. In the event of a turn higher, the 20-day SMA could hold as resistance, maintaining the near-term downside focus.
Recommended by Daniel Dubrovsky
How to Trade Gold
XAU/USD Daily Chart
Chart Created Using TradingView
— Written by Daniel Dubrovsky, Senior Strategist for DailyFX.com
To contact Daniel, follow him on Twitter:@ddubrovskyFX


Comments are closed.