
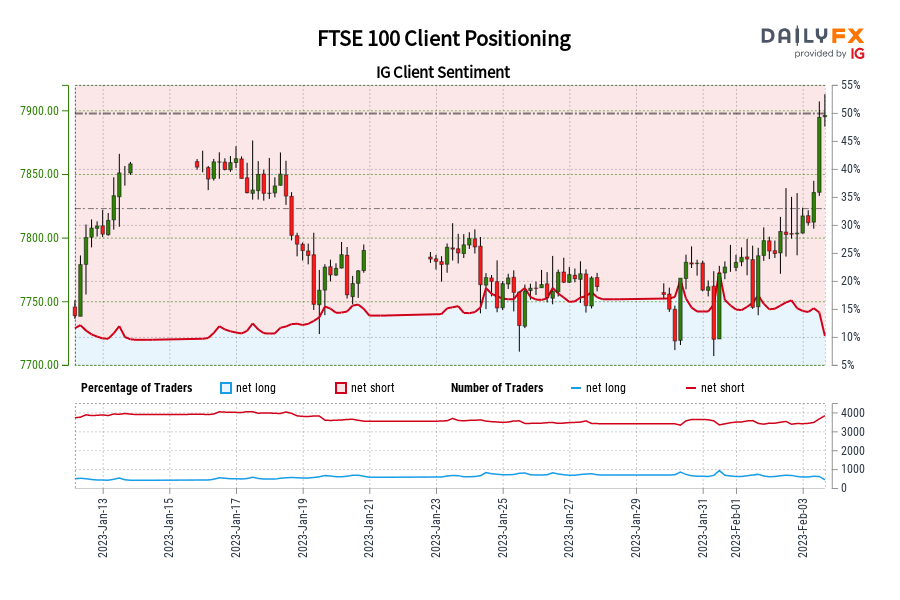
Our data shows traders are now at their least net-long FTSE 100 since Jan 14 when FTSE 100 traded near 7,857.90.

Number of traders net-short has increased by 12.89% from last week.
| SYMBOL | TRADING BIAS | NET-LONG% | NET-SHORT% | CHANGE IN LONGS | CHANGE IN SHORTS | CHANGE IN OI |
|---|---|---|---|---|---|---|
| FTSE 100 | BULLISH | 9.26% | 90.74% |
-34.98% Daily -44.03% Weekly |
11.91% Daily 12.89% Weekly |
4.91% Daily 3.18% Weekly |
FTSE 100: Retail trader data shows 9.26% of traders are net-long with the ratio of traders short to long at 9.80 to 1. Our data shows traders are now at their least net-long FTSE 100 since Jan 14 when FTSE 100 traded near 7,857.90. The number of traders net-long is 34.98% lower than yesterday and 44.03% lower from last week, while the number of traders net-short is 11.91% higher than yesterday and 12.89% higher from last week.
We typically take a contrarian view to crowd sentiment, and the fact traders are net-short suggests FTSE 100 prices may continue to rise.
Traders are further net-short than yesterday and last week, and the combination of current sentiment and recent changes gives us a stronger FTSE 100-bullish contrarian trading bias.
Comments are closed.