Daily Forex News and Watchlist: AUD/CAD
AUD/CAD is almost back at a key inflection point in the 15-minute time frame!
Will the retest lead to another bearish bounce for the pair?
Before moving on, ICYMI, yesterday’s watchlist checked out USD/CAD’s short-term range ahead of the U.S. and Canada both printing housing-related data. Be sure to check out if it’s still a good play!
And now for the headlines that rocked the markets in the last trading sessions:
Fresh Market Headlines & Economic Data:
Canada Housing Starts for August: 244K vs. 242K in July – CMHC
Canada Raw Material Prices for August: 3.0% m/m (2.7% m/m forecast; 3.5% m/m previous); Industrial Producer Prices Index: 1.3% m/m (0.5% m/m; forecast; -0.1% m/m previous)
NAHB U.S. housing index down from 50 to 45 in September; “High mortgage rates are clearly taking a toll on builder confidence and consumer demand”
RBA meeting minutes: Members considered a 25 bps rate hike in September but chose to hold over risks that the economy could slow more than forecast
Switzerland’s trade surplus widened from 3.13B CHF to 4.05B CHF in August as exports (+5.9% m/m) outpaced imports (+1.5% m/m)
Eurozone’s current account surplus shrank from 35.8B EUR to 20.9B EUR in July
Price Action News

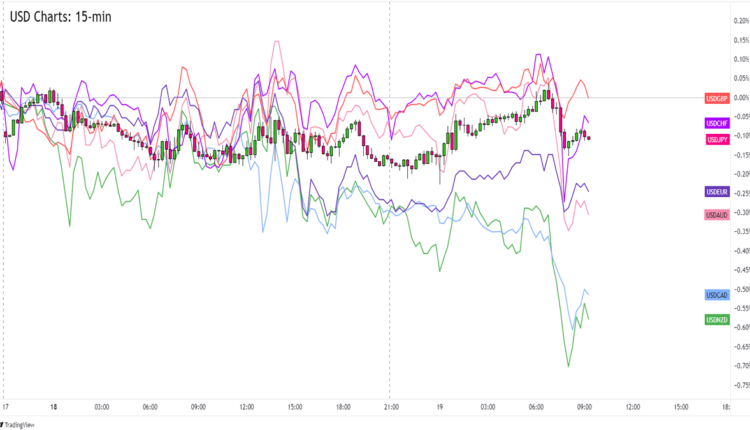
Overlay of USD Pairs: 15-min Charts
The U.S. dollar started the day on a relatively strong note against its major counterparts as Asian session traders turned cautious ahead of this week’s top-tier data releases.
USD’s shallow intraday uptrends took a sharp U-turn at the start of European trading, however. While there were no direct catalysts, London session traders may have been tracking higher oil prices or taking their USD bets off ahead of tomorrow’s FOMC decision.
In any case, the U.S. dollar is trading near new intraday lows against the commodity-related currencies but higher against safe haven counterparts like JPY and CHF.
Eurozone final CPI numbers at 9:00 am GMT
Canada’s CPI reports at 12:30 pm GMT
U.S. building permits at 12:30 pm GMT
NZ current account at 10:45 pm GMT
Japan’s trade balance at 11:50 pm GMT
Australia’s MI leading index at 12:30 am GMT (Sept 20)
PBOC’s one and five-year loan prime rates at 1:15 am GMT (Sept 20)
Use our new Currency Heat Map to quickly see a visual overview of the forex market’s price action! 🔥 🗺️

AUD/CAD 15-min Forex Chart by TV
Earlier today, the Reserve Bank of Australia’s (RBA) meeting minutes showed us that members also seriously considered a 25 bps rate hike in September.
Concerns for slower-than-expected growth won this time, especially since the central bank also believes that “The recent flow of data was consistent with inflation returning to target within a reasonable timeframe while the cash rate remained at its present level.”
Luckily for AUD bulls, the London session started with risk-taking that took comdolls like AUD higher.
AUD/CAD is currently trading near .8675, which is just below the .8690 Pivot Point level in the 15-minute time frame. Not only that, but it’s also near the chart’s 100 SMA and key inflection point.
Will we see new weekly lows for AUD/CAD in the next trading sessions?
Remember that analysts see Canada’s headline and core consumer inflation ticking higher in August. If the numbers print higher than their July readings, then the Bank of Canada’s (BOC) potential hawkishness may highlight the RBA’s not-so-hawkish September decision.
AUD/CAD could drop to its .8670 previous low or make new weekly lows.
Of course, AUD/CAD’s next up or downswings may depend on overall risk sentiment and maybe crude oil price trends.
For now, make sure you’re looking at AUD/CAD’s areas of interest so you don’t miss any interesting price moves!


Comments are closed.