Gold Prices Bounce Off Fibonacci Support, Attacks Cluster Resistance. What Now?
GOLD PRICE FORECAST:
- Gold prices rebound heading into the weekend, challenging cluster resistance stretching from $1,920/$1,930
- Despite Friday’s recovery, the fundamental backdrop remains challenging for precious metals
- Next week, all eyes will be on the FOMC announcement
Trade Smarter – Sign up for the DailyFX Newsletter
Receive timely and compelling market commentary from the DailyFX team
Subscribe to Newsletter
Related: Gold Price on Meltdown Alert as USD Eyes Breakout Before Fed, XAU/USD Levels
Gold prices (XAU/USD) rebounded on Friday on risk-off sentiment, shrugging off the rise in U.S. Treasury yields ahead of a key FOMC gathering in the coming days. In late morning trading, bullion was up about 0.75% to $1,925 as equity indices took a nosedive, with the Nasdaq 100 down nearly 1% amid widespread weakness in the technology sector.
Despite today's move, the precious metal's advance may be temporary, especially if the Federal Reserve embraces a hawkish position at its September meeting. The U.S. central bank is expected to keep interest rates unchanged next week, but could leave the door open to additional monetary tightening this year and signal that monetary policy will stay restrictive for an extended period.
With the U.S. economy displaying remarkable resilience, as demonstrated by recent data, the Fed should remain vigilant. Prematurely declaring victory could ease financial conditions dramatically, endangering the progress made on the inflation front thus far. Policymakers are likely aware of this, and as a result, may lean towards a higher-for-longer stance and maximum optionality – a negative outcome for gold.
Elevate your trading prowess with a comprehensive analysis of gold prices, encompassing both long-term fundamentals and technical insights. Get the quarterly guide now!
Recommended by Diego Colman
Get Your Free Gold Forecast
GOLD PRICE TECHNICAL ANALYSIS
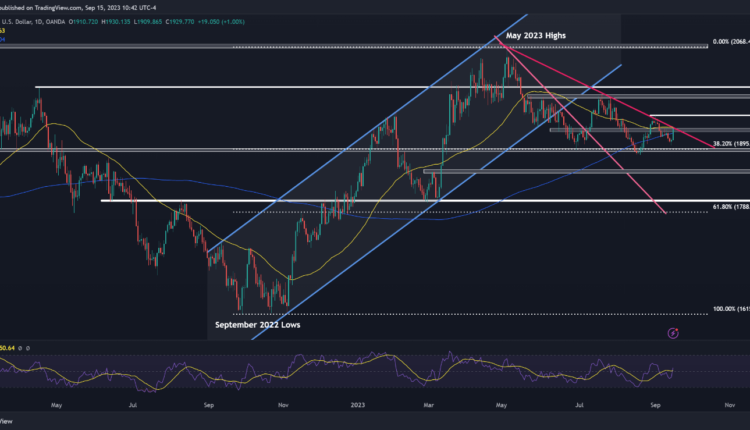
After a subdued performance in recent days, gold accelerated higher on Friday, reclaiming its 200-day simple moving average, and threatening to push past cluster resistance in the $1,920/$1,930 region. If the bulls manage to drive prices above this ceiling, buying interest could intensify, paving the way for a potential move toward $1,955. Further strength would then draw attention to $1,985.
On the flip side, if sellers return and catalyze a bearish reversal, initial support is seen around $1,895, which corresponds to the 38.2% Fibonacci retracement of the September 2022/May 2023 rally. While this zone might act as a robust defensive line against additional declines, a breach below it could amplify downward impetus, setting the stage for a pullback toward the $1,855 mark.
Obtain the expertise required to maintain trading consistency. Grab your copy of the “How to Trade Gold” guide, featuring priceless insights and tips from our team of experts!
Recommended by Diego Colman
How to Trade Gold
GOLD PRICE TECHNICAL CHART
Gold Price Chart Prepared Using TradingView


Comments are closed.