Japanese Yen Slides on BoJ and Fed Commentary from Jackson Hole. Higher USD/JPY?
Japanese Yen, USD/JPY, US Dollar, BoJ, Intervention, JGB, Yields, Ueda, Powell – Talking Points
- USD/JPY is contemplating new peaks after reaching higher this week
- The BoJ and the Fed appear to be on differing paths, and it might assist USD/JPY
- The moves in Treasury yields might hold the key for USD/JPY direction
Trade Smarter – Sign up for the DailyFX Newsletter
Receive timely and compelling market commentary from the DailyFX team
Subscribe to Newsletter
The Japanese Yen is threatening to make another 10-month low to start Monday after comments from the leaders of the Bank of Japan (BoJ) and the Federal Reserve appear to have opened the gate for higher USD/JPY.
Speaking from Jackson Hole over the weekend, BoJ Governor Kazuo Ueda said, “We think that underlying inflation is still a bit below our target, this is why we are sticking with our current monetary easing framework.”
The market has interpreted the comments as dovish with USD/JPY again trading above 146.60.
Conversely, Fed Chair Jerome Powell spoke on Friday and maintained the mantra that rates will need to be higher for longer, underpinning the US Dollar.
This has potentially set the stage for USD/JPY to move above the levels of where the BoJ initially started selling in September last year.
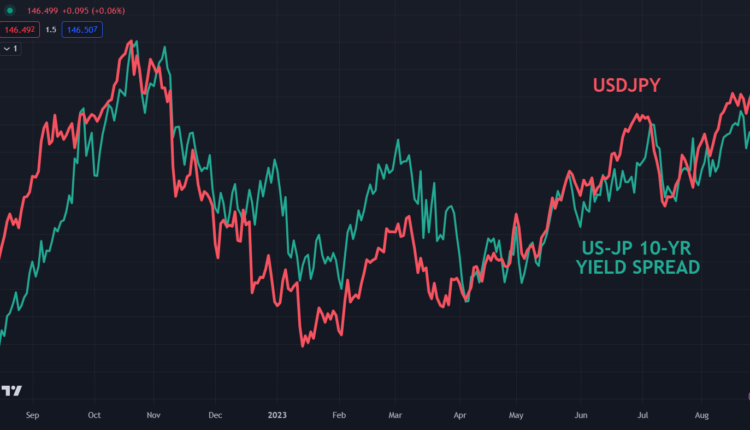
However, the decline in USD/JPY really got underway on the round of official selling in October, which was subsequently assisted by the retreat in Treasury yields. That move lower saw the spread to Japanese Government Bonds (JGB) narrow.
In the current episode, a tick-up in US debt returns might provide a catalyst for USD/JPY to challenge the 30-year peak.
The market is generally not anticipating physical intervention until the price moves toward 152.00, if at all. The November 2022 high was 151.95.
In the meantime, there could be more jawboning from Japanese officials but given Governor Ueda’s recent comments, that may not happen unless there is a sudden weakness in the Yen.
USD/JPY AND YIELD SPREAD BETWEEN 10-YEAR TREASURIES AND JGBS
Chart created in TradingView
Recommended by Daniel McCarthy
How to Trade USD/JPY
USD/JPY TECHNICAL ANALYSIS SNAPSHOT
USD/JPY is looking to add to recent gains to start the week after making a 10-month high on Friday.
If a bullish run emerges, resistance might be at the prior peaks of 148.85 and 151.95.
On the downside, support may lie at the breakpoints in the 145.05 – 145.10 area ahead of the prior lows near 144.50 and 141.50.
The 21-day Simple Moving Average (SMA) is also near 144.50 and may provide support.

Chart created in TradingView
Recommended by Daniel McCarthy
How to Trade FX with Your Stock Trading Strategy
— Written by Daniel McCarthy, Strategist for DailyFX.com
To contact Daniel, use the comments section below or @DanMcCathyFX on Twitter


Comments are closed.